
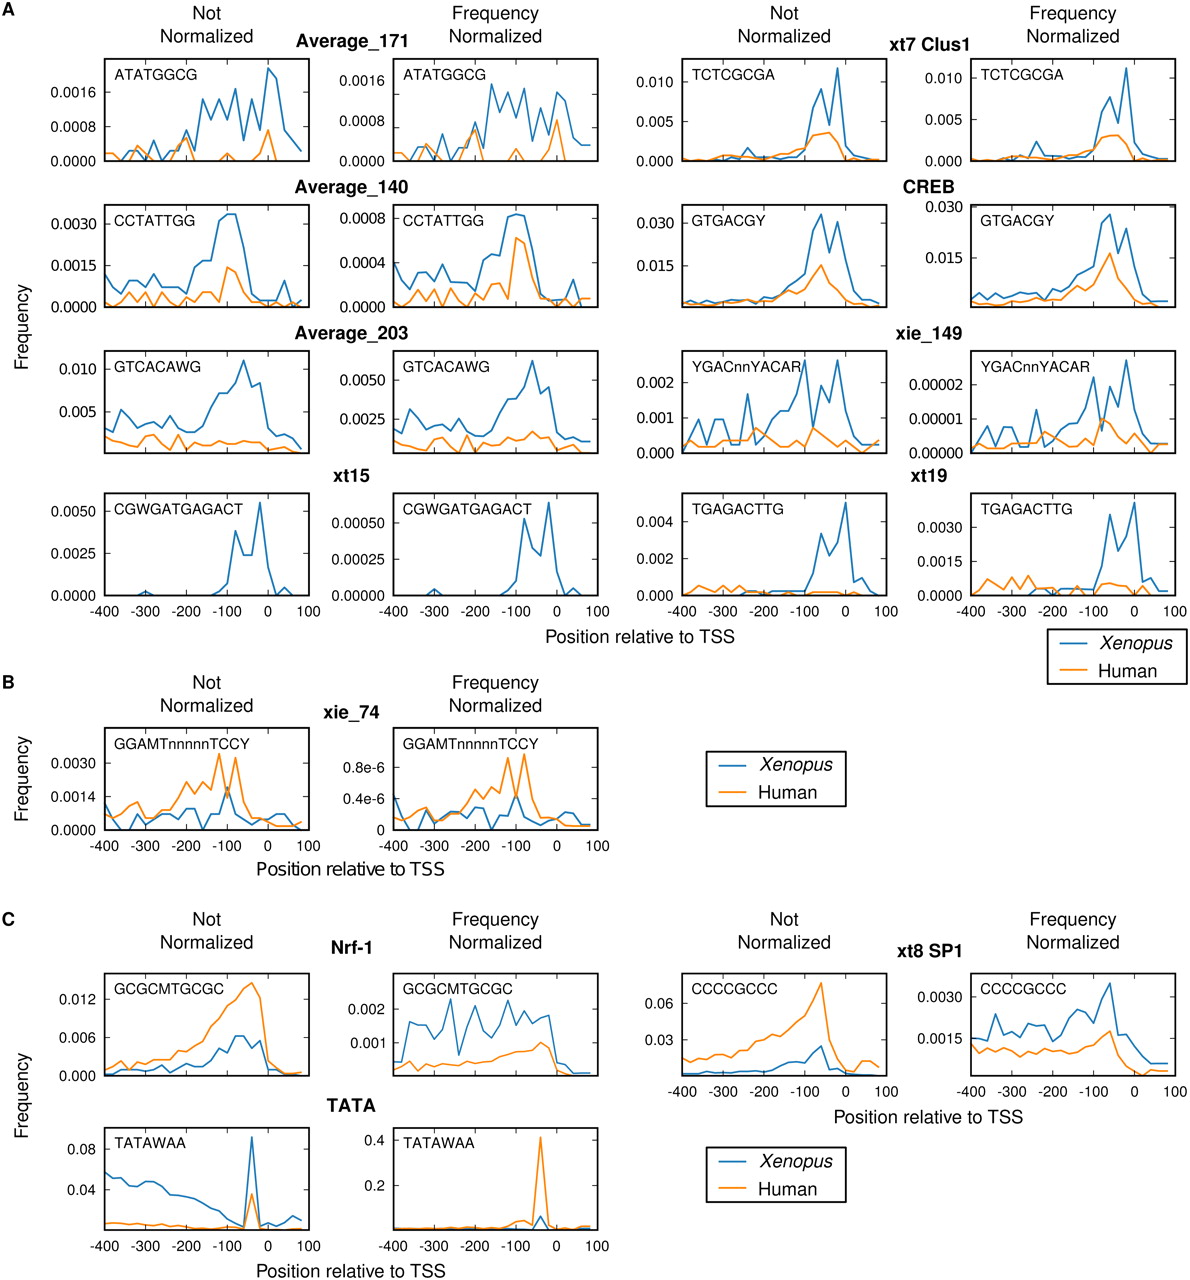
Comparison of Xenopus and human promoter elements. (A) Distribution of motifs specifically enriched in Xenopus promoters relative to human promoters. The distribution of the positions of the motifs within a region from −400 to +100 relative to the TSS was determined by binning these positions at 20-bp resolution in Xenopus (blue) and human (orange) promoters. The left panel for each motif shows the frequency per bin; the right panel shows the normalized frequency, based on the motif consensus, using the nucleotide frequencies in that bin. (B) Distribution of motifs specifically enriched in human promoters relative to Xenopus promoters. (C) Distribution of motifs that have a different species-preferential enrichment before and after nucleotide frequency normalization.


