
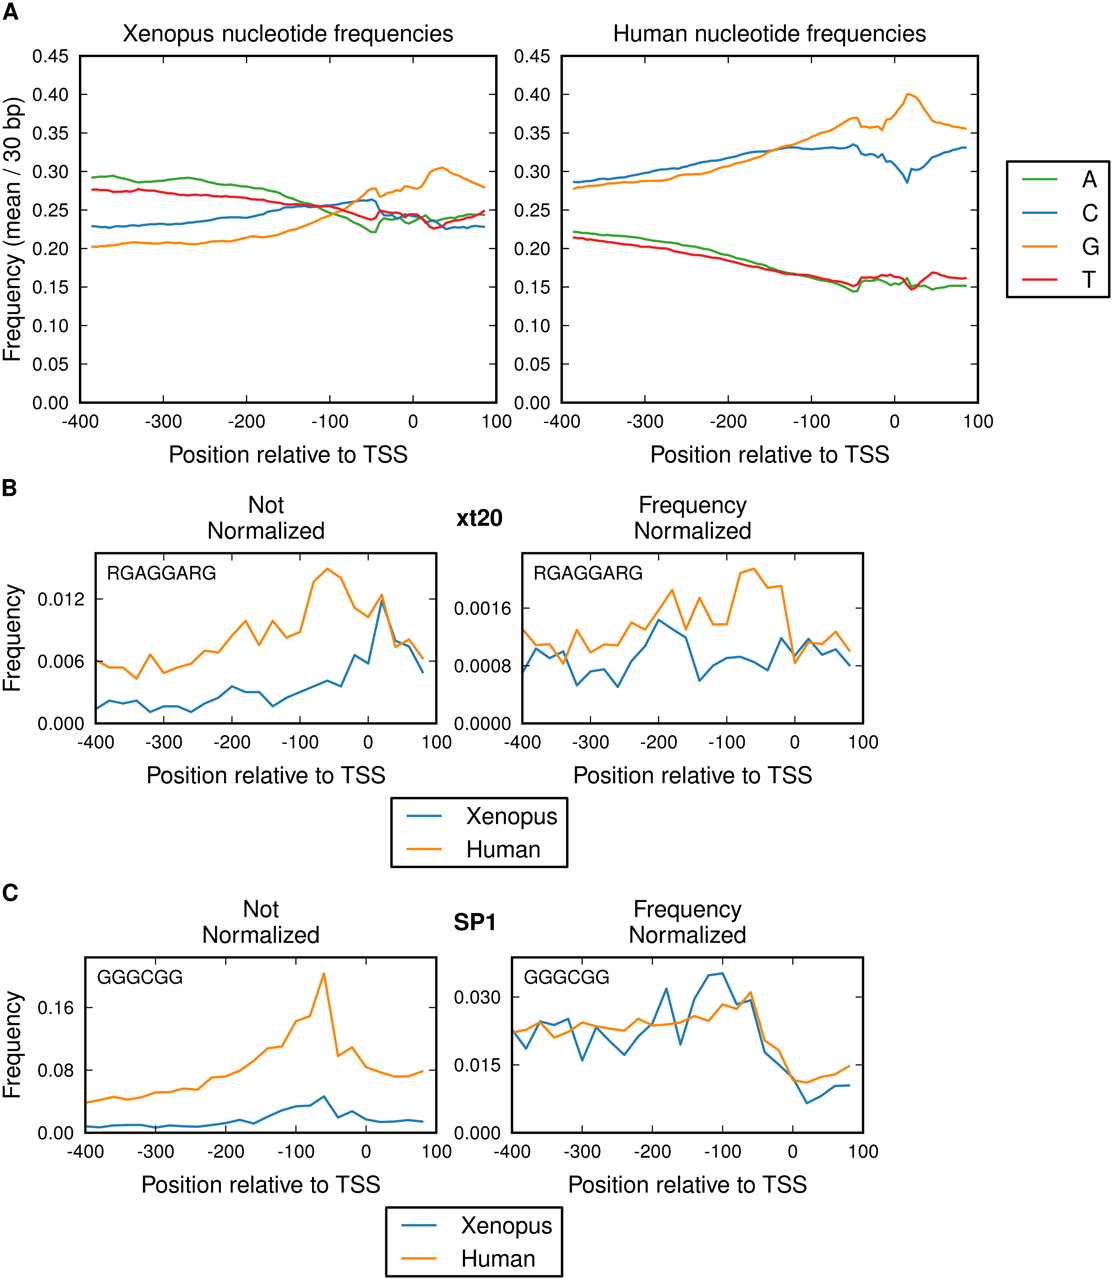
Normalization by nucleotide frequencies. (A) The nucleotide frequency (mean nucleotide fraction in a 30-bp window) is plotted for Xenopus (left panel) and human (right panel) promoters (A, green; C, blue; G, yellow; T, red). (B) The effect of nucleotide frequency normalization on the distribution of the xt20 motif. The distribution of the positions of the motif within a region from −400 to +100 relative to the TSS was determined by binning these positions at 20-bp resolution. Shown is the unnormalized (left panel) and normalized (right panel) distribution in Xenopus (blue) and human (orange) promoters. The frequencies in the right panel are normalized, based on the motif consensus, using the nucleotide frequencies in that bin. (C) The effect of nucleotide frequency normalization on the distribution of the SP1 motif.


