
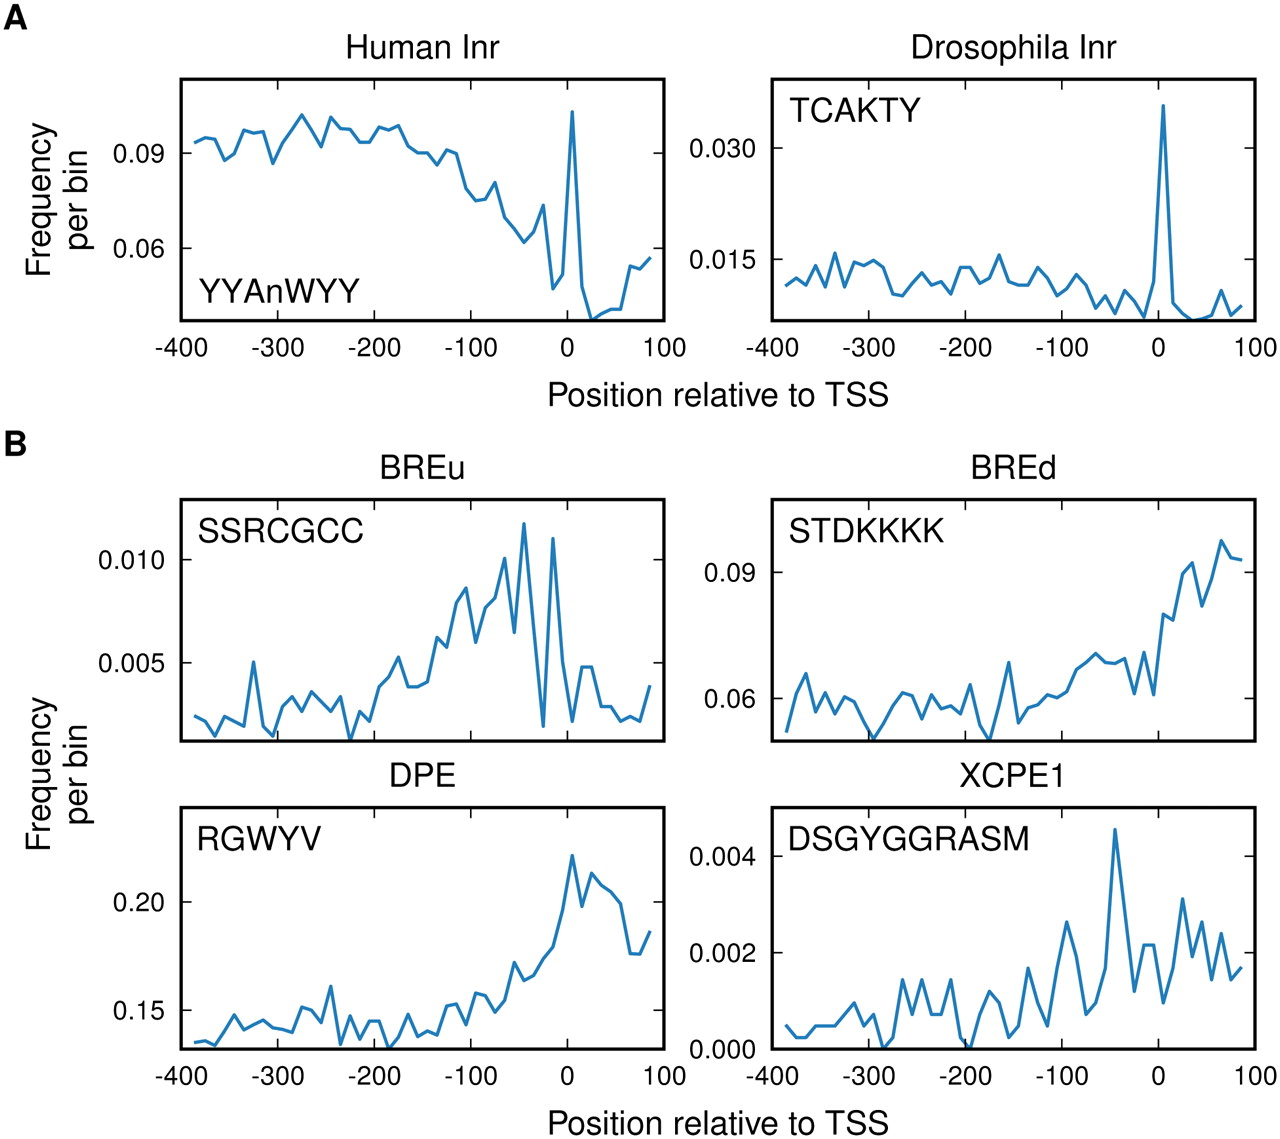
Figure 4.
Distribution of known core promoter motifs in Xenopus promoters. The distribution of the positions of the motifs within a region from −400 to +100 relative to the TSS was determined by binning these positions at 10-bp resolution.


