
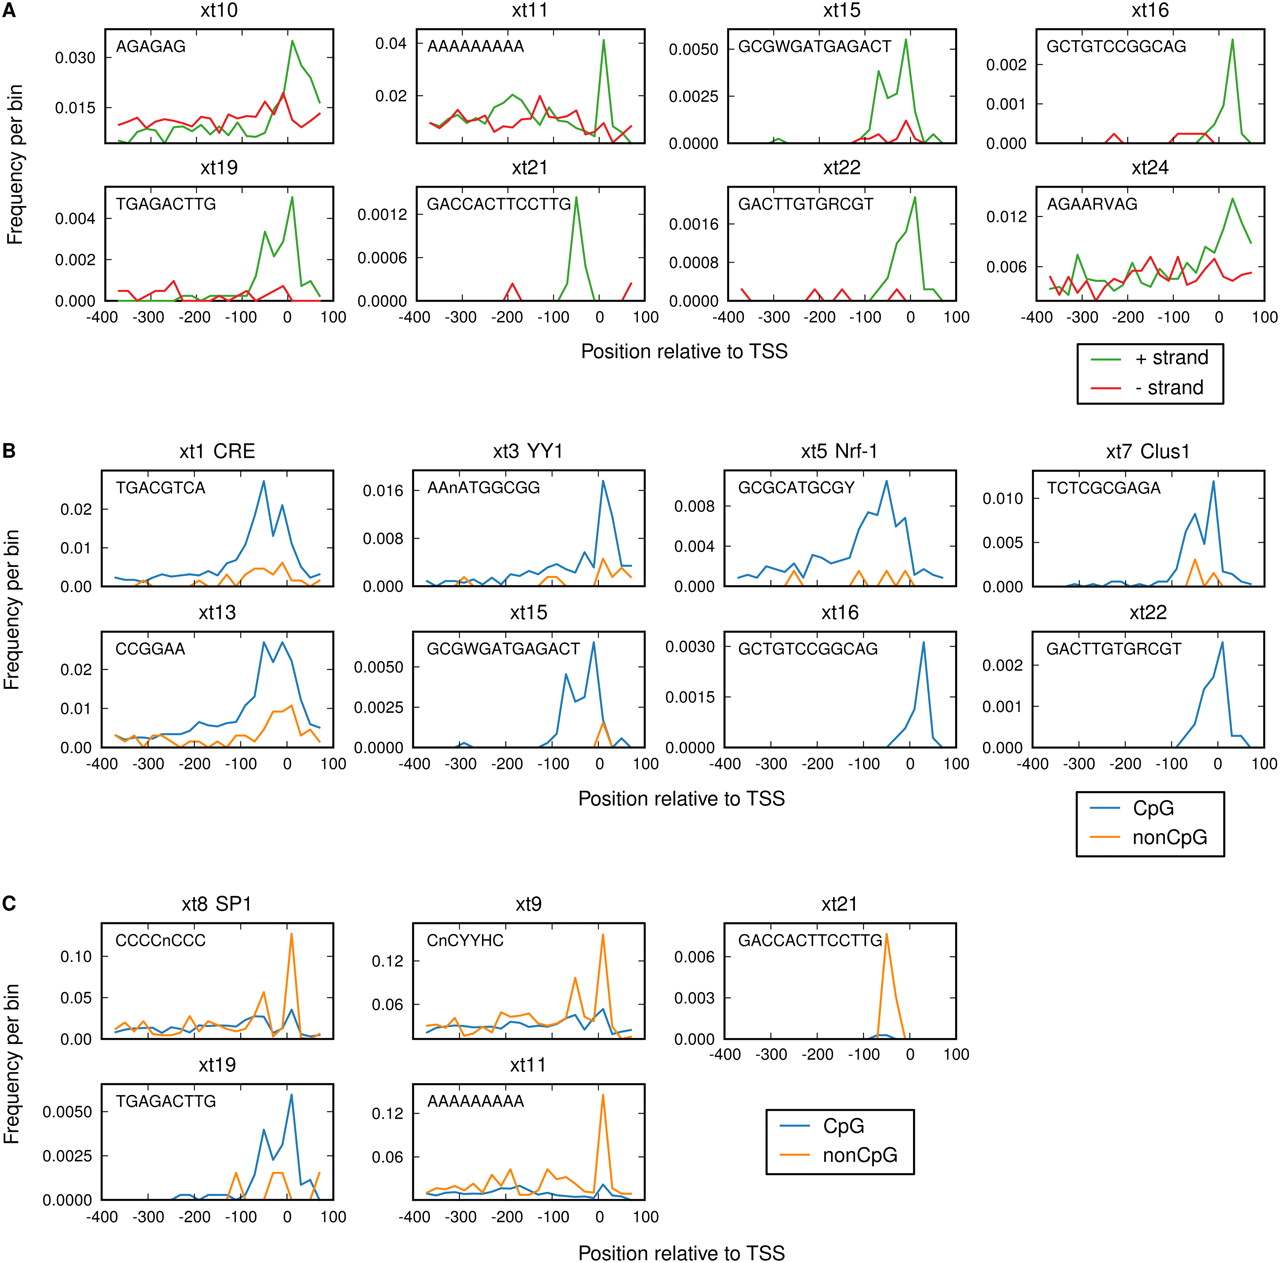
Differences in distribution of Xenopus promoter motifs. (A) Distribution of predicted Xenopus promoter motifs (Table 1) in the + and the − orientation. The matches in the region from −400 to +100 relative to the transcription start site (TSS) are binned at 20-bp resolution for the forward (green) and the reverse (red) orientation. Only motifs for which the distribution is different are shown (for all motifs, see Supplemental Fig. S4). (B) Predicted motifs containing a CpG dinucleotide are preferentially enriched in CpG-island promoters (blue) versus non-CpG promoters (orange). (C) Predicted motifs without a CpG dinucleotide preferentially enriched in either CpG-island promoters (blue) or non-CpG promoters (orange).


