
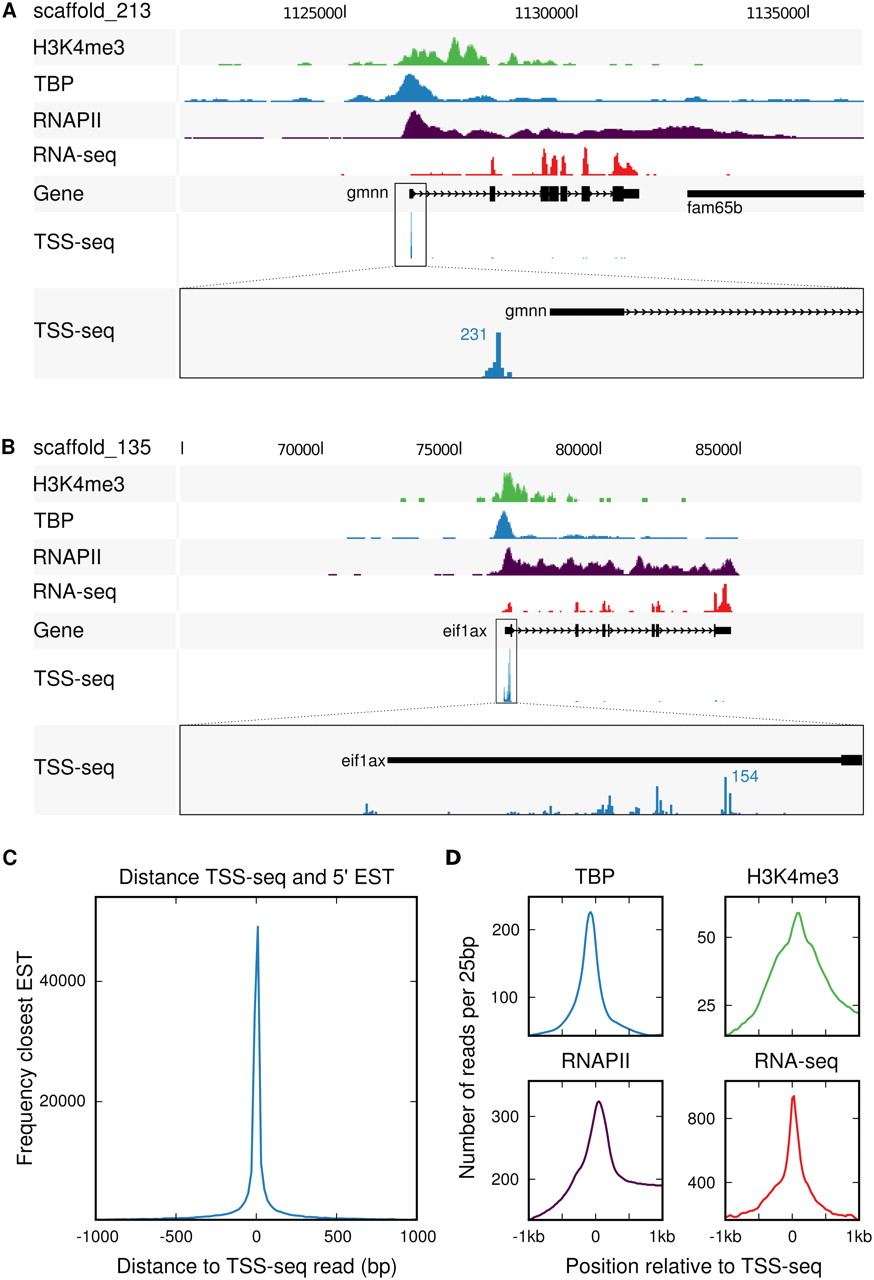
TSS-seq accurately defines transcription start sites. (A) Focused transcription initiation at the gmnn gene locus on scaffold_213, visualized using the UCSC Genome Browser. Shown are ChIP-seq profiles for (from top to bottom) H3K4me3 (green), TBP (blue), and RNAPII (purple), as well as RNA-seq data (red). The reads obtained by sequencing the 5′ end of oligo-capped transcripts (TSS-seq) are shown in the lower two tracks. The lower track shows a 90× magnification of the TSS-seq track. (B) Dispersed transcription initiation at the eif1ax gene locus on scaffold_135, visualized using the UCSC Genome Browser. (C) Histogram of the distance between the TSS-seq reads and the 5′ end of the closest EST, summarized for every TSS-seq read. (D) ChIP-seq profiles of TBP (blue, upper left), H3K4me3 (green, upper right), and RNAPII (purple, lower left), as well as RNA-seq (red, lower right), around the start position of TSS-seq reads.


