
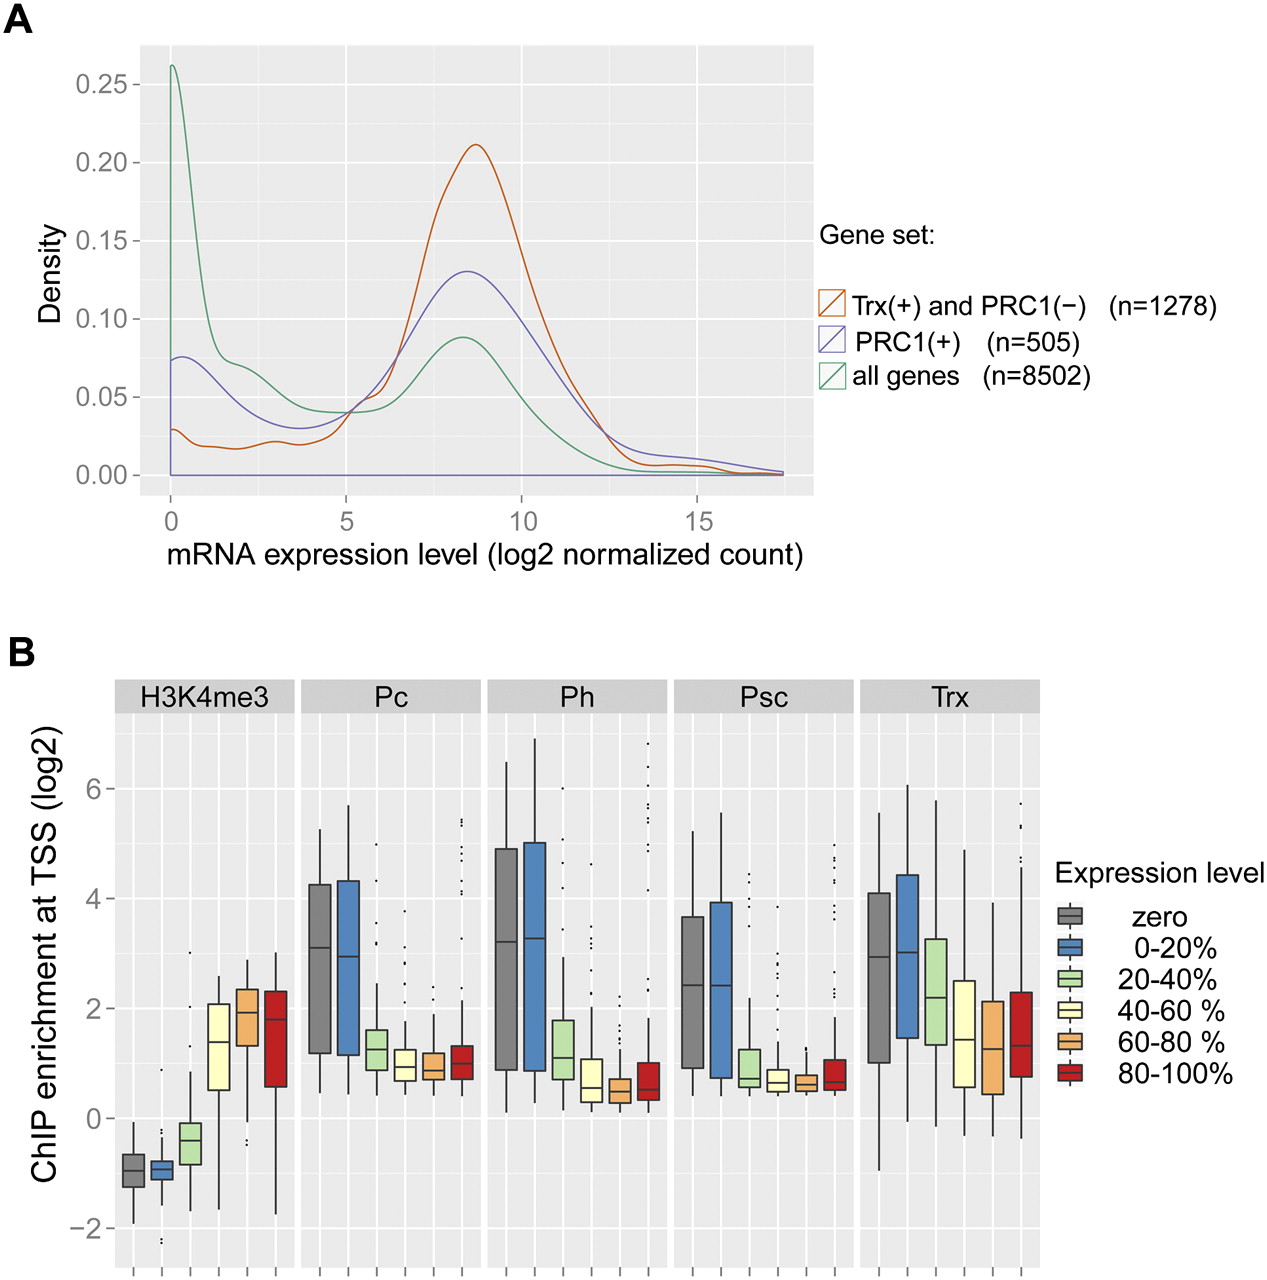
Expression levels of PcG and TrxG target genes. (A) Distributions of mRNA expression levels over all analyzed genes (green), genes only bound by TRX (orange), or PRC1-bound genes (violet). Numbers of mRNAs in the three different classes are indicated. (B) Genes were classified into nonexpressed (log2 mRNA expression level below 5.0, gray) and five groups of increasing expression, each containing the same number of genes (blue to red). ChIP-seq enrichments at the TSS are shown as box plots for each expression level group, with the horizontal line indicating the median, the lower and upper box limits the first and third quartiles, and the lines below and above the box extending to the minimum and maximum enrichments, respectively.


