
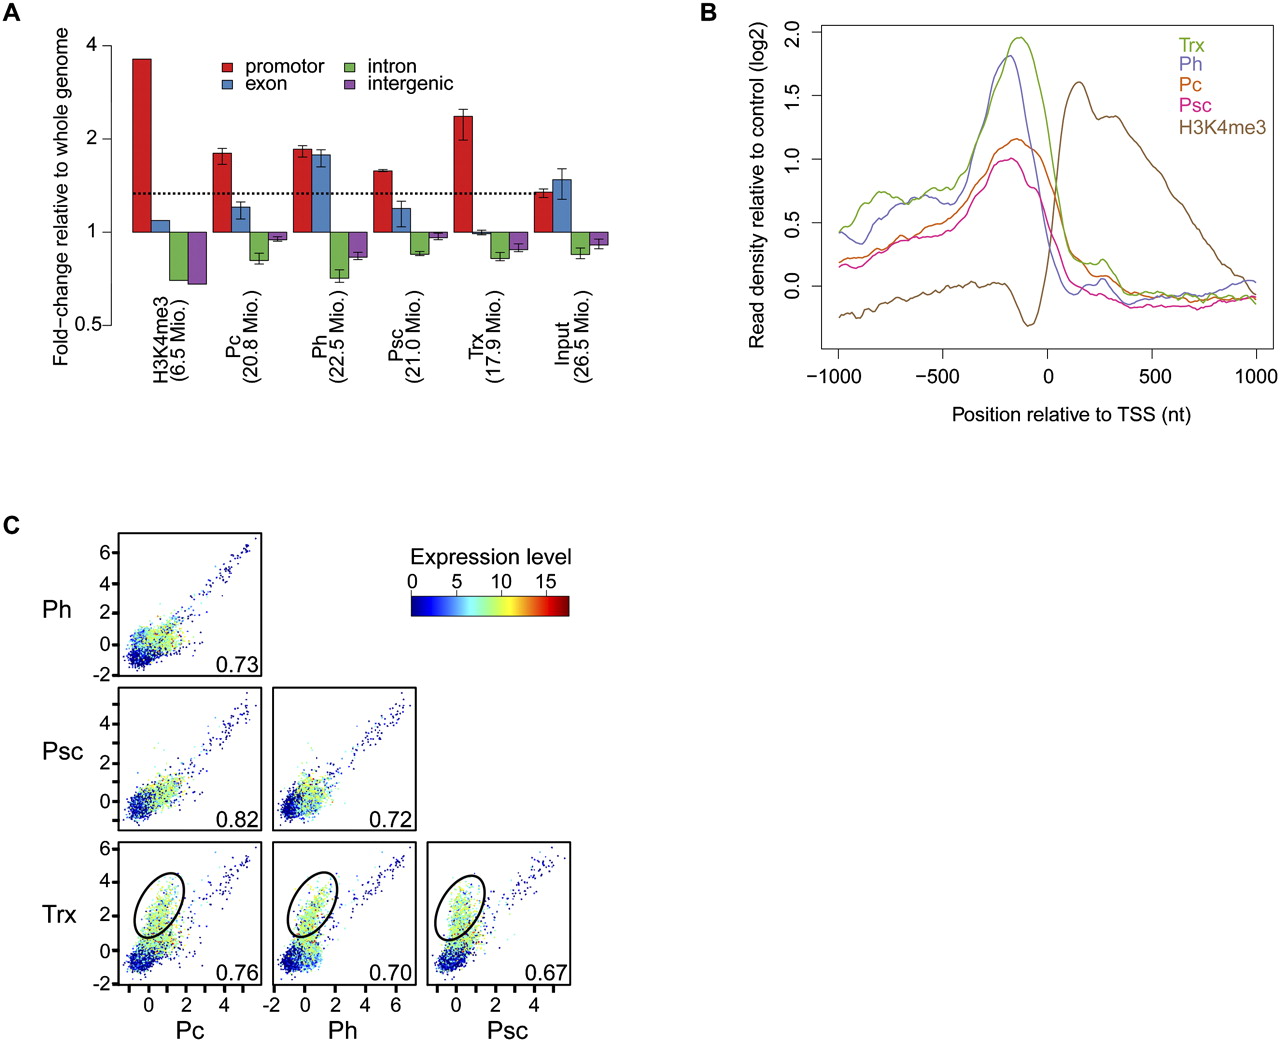
PcG proteins and TRX-C are enriched in promoter regions. (A) Enrichment of read alignments (number in parentheses) in gene promoters (±500 bp around TSS), exons, introns, and intergenic regions. All ChIPs show enrichment in the gene promoters compared with the input control (dotted line). For samples with two biological replicates (Pc, Ph, Psc, TRX, and Input), the bars indicate the mean enrichments, and the whiskers correspond to minimal and maximal enrichments. (B) Composite enrichment profiles relative to the chromatin input controls for all ChIPed proteins in 2-kb windows around nonoverlapping RefSeq TSS (n = 8977). (C) Pairwise scatter-plots of TSS enrichments between Pc, Ph, Psc, and TRX-C samples. Each dot represents one promoter, whereas the color of the dot indicates the expression level of the corresponding transcript, from blue (not expressed) to red (highly expressed). The Pearson correlation coefficient is depicted in the lower right corner of each scatter plot. Promoters with high TRX-C and low or absent PcG protein signals are encircled; note that the corresponding transcripts show generally a higher expression level compared to the ones located on the diagonal.


