
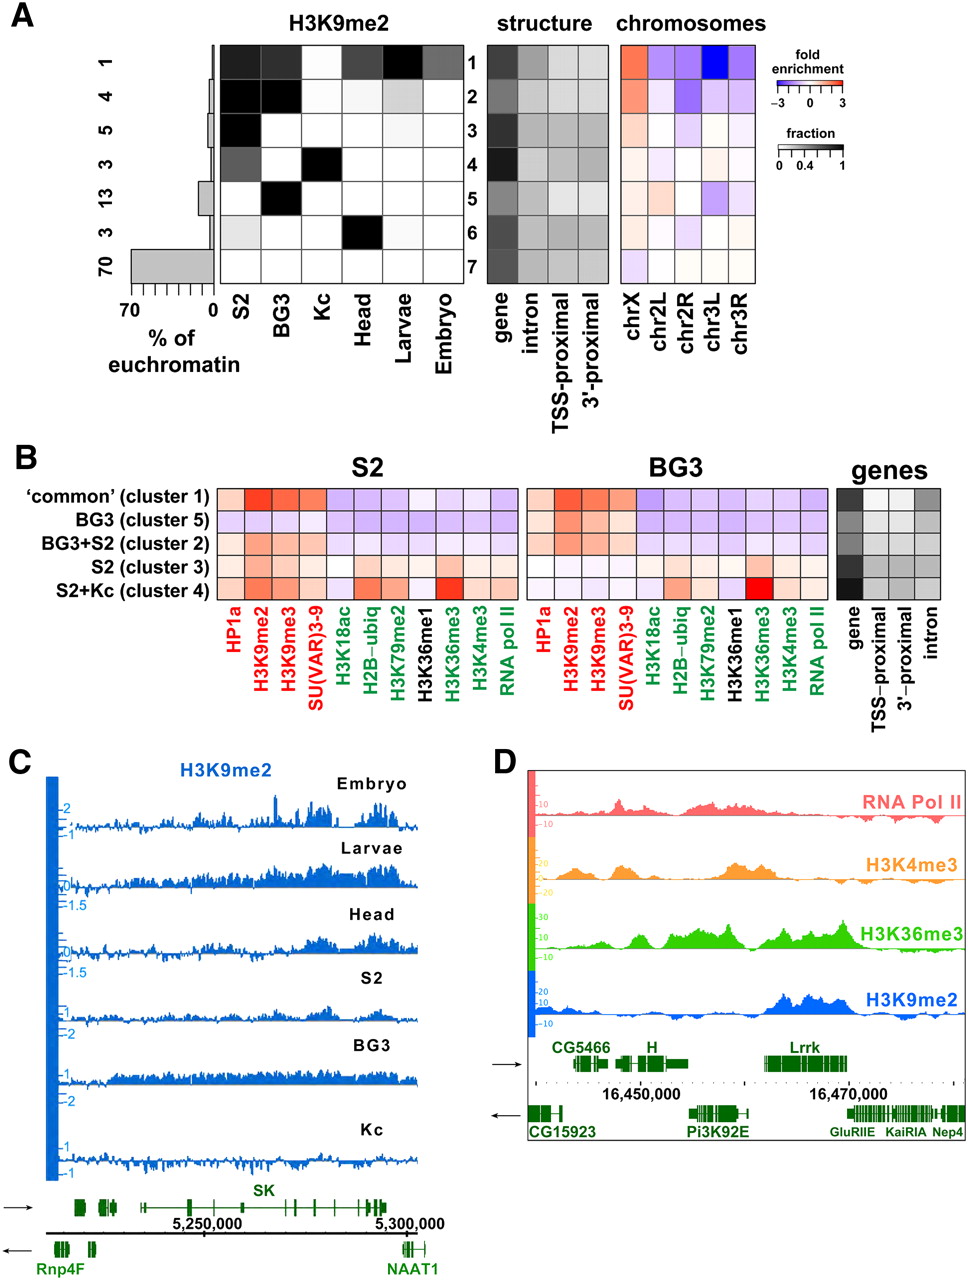
BG3 and S2 cells show novel domains of H3K9me2 enrichment within euchromatic regions. (A) Regions of H3K9me2 enrichment across different cell types. The euchromatic portion of the genome (excluding regions defined as heterochromatin by the border analysis; see Fig. 3A) was subdivided into sets of regions that exhibit a common pattern of H3K9me2 enrichment across different cell types. Each box shows the fraction (grayscale) of the regions belonging to the set (row) that are enriched for H3K9me2 in a particular cell type (column). The histogram on the left shows the fraction of the euchromatic genome in each row (1–7), with exact %s to the left. Regions in row 7 lack H3K9me2 across all examined cell types, whereas row 1 groups regions enriched for H3K9me2 in all examined cell types (except for Kc cells). Rows 2–6 identify other euchromatic regions that display H3K9me2 enrichment in only a subset of cell types (e.g., only BG3 cells (row 5) or S2 cells (row 3), or both (row 2). Panel 2 shows the fraction of sequence within each group associated with different parts of annotated genes (gene, entire gene; TSS-prox. [±500 bp of the TSS annotated in Flybase], 3'-prox. [±500 bp of the 3'end annotated in Flybase], and intron are a subset of the sequences included in the “gene” column). The third panel shows over-/under-representation of each cluster on different chromosome arms, which was calculated by comparing the fraction of sequence of a cluster on a specific chromosome with the fraction of sequence the chromosome contributed to the array. (B) Average enrichment of chromatin marks in the cell-type-specific H3K9me2 enrichment domains. Each row shows average enrichment levels (log2 scale) within regions corresponding to the main patterns seen in A. The specific regions were identified using HMM segmentation (see Methods). Panel 1 shows the average enrichment patterns in S2 cells, panel 2 shows the average enrichment patterns for the same genomic regions in BG3 cells, and panel 3 indicates the fraction of the particular H3K9me2 enrichment domain associated with gene features. While “common,” BG3 and BG3+S2 domains (rows 1–3) are enriched only for heterochromatic marks, the S2-specific and S2+Kc-specific domains (rows 4,5) include actively transcribed genes that in S2 cells are enriched for heterochromatic marks along with marks normally associated with transcription, similar to “mixed” state genes found in heterochromatin (Fig. 4). (C) Browser shot showing an example of a gene from a “common” (row 1) domain, located in the euchromatic arm of chromosome X, and enriched for H3K9me2 across all examined cell types except Kc cells. x-axis, chromosomal position in base pairs (centromere to the left). Genes are indicated in green with their orientations as indicated by the arrows. y-axis, H3K9me2 enrichment levels (log2 scale) for the indicated tissue. (D) A representative region of arm 3R containing an S2-specific domain (row 3), showing a combination of H3K9me2 (blue) and marks associated with active transcription—H3K36me3 (green), H3K4me3 (orange), and Pol II (red). Two sets of genes display a divergent promoter orientation typical of the S2-unique domain genes. X-axis, chromosomal position in base pairs; y-axis, enrichment levels (log2 scale).


