
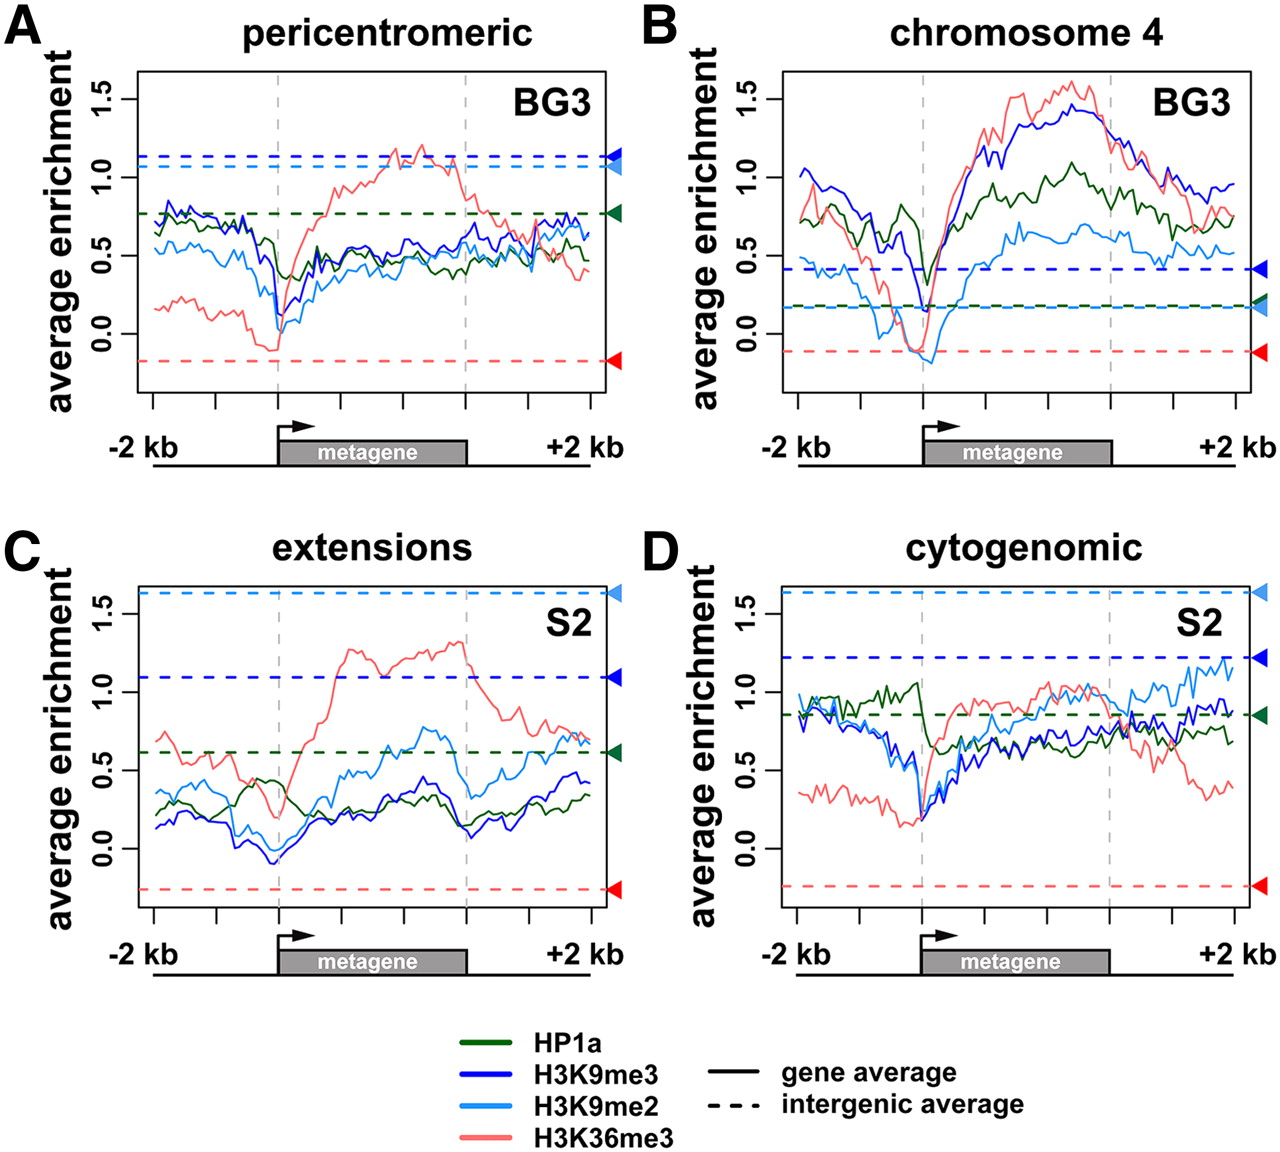
Chromatin patterns vary for expressed genes and intergenic domains located in different heterochromatin regions. The plots show log2 enrichment (y-axis) for H3K36me3 (red), H3K9me2 (light blue), H3K9me3 (dark blue), and HP1a (green) relative to a scaled metagene and 2-kb flanking regions (x-axis). The dashed horizontal lines show average levels of enrichment within intergenic regions for each modification/protein, using the same color key. (A) Average enrichment profiles for expressed pericentric genes in BG3 cells indicate that the levels of HP1a and H3K9me2/3 are higher in intergenic regions compared with gene bodies, whereas H3K36me3 levels are higher over gene bodies than in intergenic regions. Pericentric genes are located in the regions that are centromere-proximal to the BG3 epigenomic borders, including the cytogenomic heterochromatin plus the BG3 extensions (n = 235). (B) Average enrichment profiles for expressed chromosome 4 genes in BG3 cells show significantly higher levels of HP1a, H3K9me2/3, and H3K36me3 enrichment within gene bodies compared with intergenic region averages (n = 58). (C) Average enrichment profiles genes in S2 cells located (C) within the S2-specific extension regions (between the S2 and BG3 epigenomic borders). Profiles for 60 such genes that are expressed in both S2 and BG3 cells are shown. (D) Average enrichment profiles in S2 cells for expressed genes located within the pericentric heterochromatin defined by the cytogenomic borders (excluding 3Rh; n = 117). In S2 cells, the extensions and cytogenomic heterochromatin have comparable levels of enrichment for all four marks within the intergenic regions. However, at active genes, the levels of HP1a and H3K9me2/3 are lower in the extensions than in the cytogenomic regions.


