
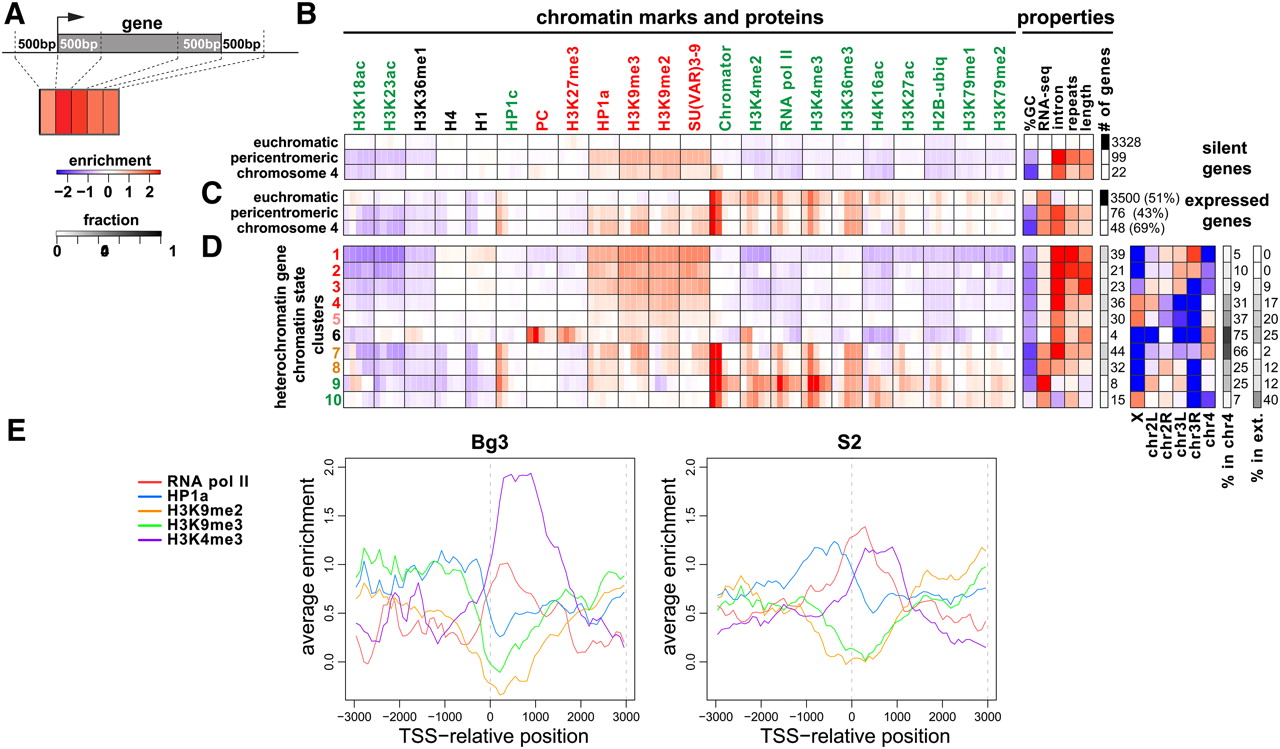
Genes within heterochromatin have specialized properties. (A) The observed chromatin state of each annotated gene was summarized by calculating average enrichment within the 500-bp regions flanking the 5' and 3' ends, the first and last 500 bp within the gene, and the remaining gene body. Each region is represented by the small rectangles (various shades of red in the diagram). Only nonoverlapping genes are considered in this analysis. Levels of modifications and proteins in each gene segment are indicated by shades of red (enrichment) and blue (depletion) in B–D. (B) Average patterns of enrichment for chromatin marks and proteins (log2 scale) for transcriptionally silent genes in BG3 cells. The second panel shows average G/C nucleotide content, repeat content, RNA-seq level, and gene length for each group of genes. The number of genes within each group is indicated in the last column. Transcriptionally inactive genes within heterochromatin and chromosome 4 are highly enriched for H3K9me2/me3, HP1a, and SU(VAR)3-9 over all gene segments, and depleted for most active marks, in comparison to inactive euchromatic genes. (C) Average patterns of chromatin mark enrichment for transcriptionally active genes in BG3 cells. Genes transcribed within the heterochromatic regions show enrichment for “active” marks at comparable levels to expressed euchromatic genes (e.g., H3K36me3, Pol II, H3K4me2/3, and CHRO (a chromodomain protein associated with interband regions on polytene chromosomes; Gortchakov et al. 2005; Rath et al. 2006). However, enrichment levels were noticeably reduced for some active marks (e.g., H4K16ac, H3K18ac, H3K23ac, and H3K79me1/2) compared with active euchromatic genes. Most importantly, the heterochromatic and 4th chromosome genes also contain high levels of HP1a, H3K9me2, and H3K9me3, which are not observed at active euchromatic genes. Expressed heterochromatic genes are, on average, shorter, and contain fewer intronic repeats compared with silent heterochromatic genes (cf. “length” and “repeats” in B and C). (D) Combinatorial chromatin patterns exhibited by heterochromatic genes. Genes were clustered according to their enrichment summary (A) across multiple histone modifications and chromosomal proteins (columns in panel 1; see Methods). Each row shows the average enrichment pattern of the genes within one of the 10 determined clusters. Cluster numbers are color-coded to indicate chromatin states with similar predominant patterns of “active” and “silent” marks. The last three panels show fold enrichment/depletion of each chromosome within the clusters (log2 scale), percentage of cluster regions in chromosome 4 (% in chr4), and percentage of each cluster present in the heterochromatic extensions (“% in ext.”). (E) TSS enrichment patterns at actively transcribed heterochromatic and 4th chromosome genes. The plots show average enrichment profiles for HP1a (blue), H3K9me2 (orange), H3K9me3 (green), and Pol II (red) around TSSs in BG3 cells (left, clusters 7,8 in D and corresponding clusters in S2 cells (right, Supplemental Fig. 5C, clusters 7,8). Genes with divergent promoters (of <2 kb separation) and overlapping genes were excluded, resulting in analysis of a total of 25 genes for BG3 and 32 genes for S2 cells. Average enrichment levels (log2 scale) are plotted on the y-axis relative to the TSS (0) on the x-axis (bp). The results show significant depletion of silencing marks at the TSS.


