
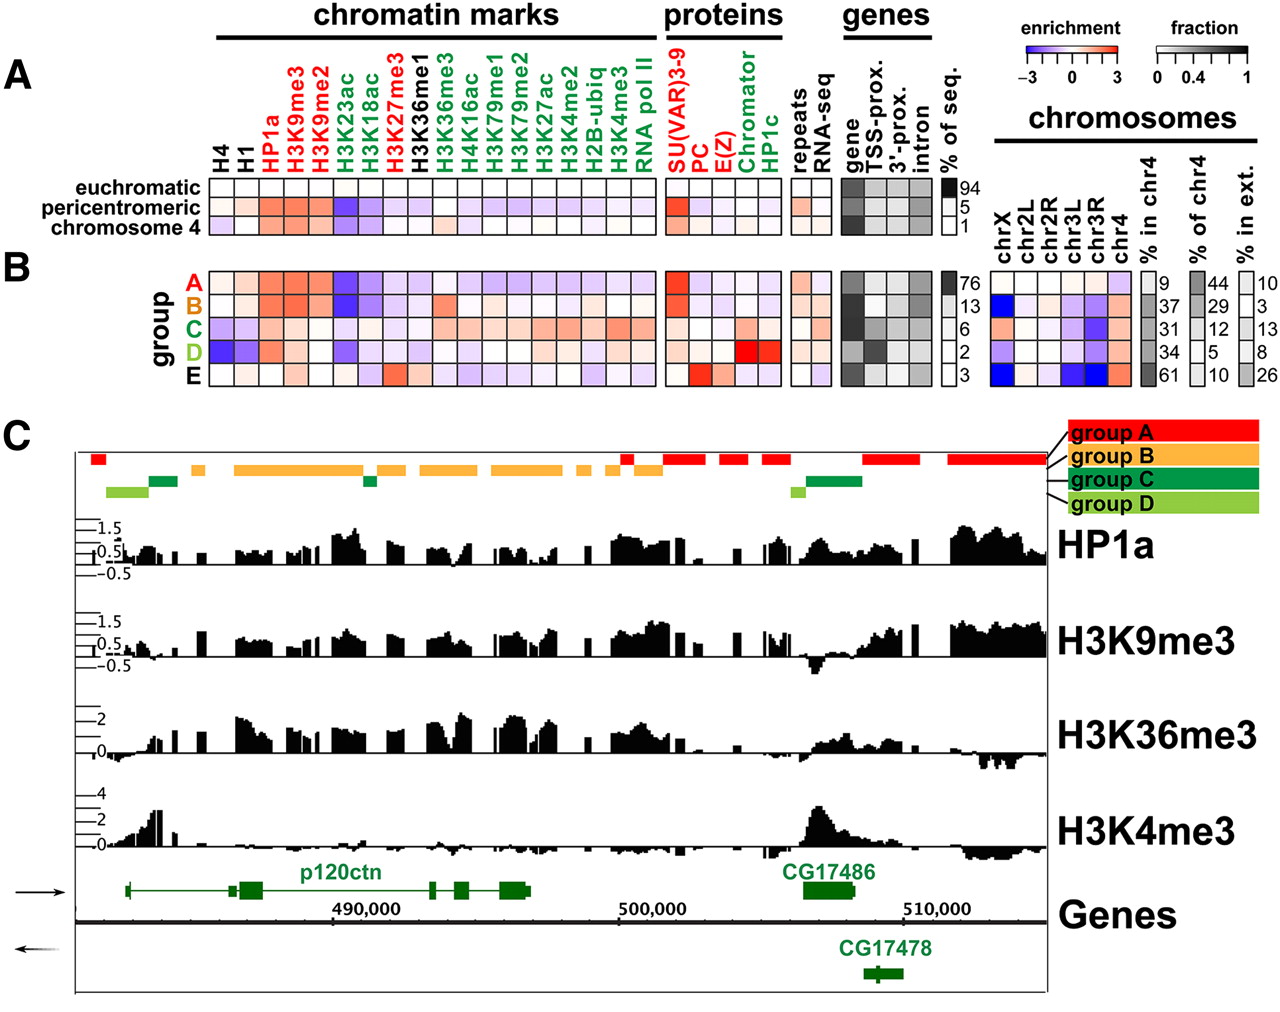
A number of specialized chromatin states characterize the centric heterochromatin and chromosome 4 in BG3 cells. (A) Average levels of enrichment of individual chromatin marks and proteins (panels 1 and 2; green, “active” marks; red, “silent” marks; black, undefined) are shown for euchromatin, pericentric heterochromatin, and chromosome 4. The colors show enrichment (red) or depletion (blue) on a log2 scale after genome-wide normalization (see Methods). There is less depletion of “active” marks on chromosome 4 (e.g., H3K4me2 and H3K27ac) and higher enrichment for H3K36me3, a modification associated with transcript elongation, compared with pericentric heterochromatin. Panel 3 gives the average enrichment for repeats and the RNA-seq signal (Z-score, relative to the array average). The fraction (represented by the gray scale) of the three genome domains associated with genes/gene elements is shown in panel 4 (gene, entire gene; TSS-prox., ±500 bp of the TSS annotated in Flybase; 3'-prox., ±500 bp of the 3'end; intron, within annotated introns). The far-right column indicates the percent of the tiled genome sequence on the oligonucleotide array in each group. See Supplemental Figure 4B for the same analysis of the enrichment patterns in S2 cells. (B) Prevalent combinatorial patterns of chromatin marks within the pericentric heterochromatin (“heterochromatin”) and chromosome 4. Sequences displaying specific combinatorial patterns of “chromatin marks” (panel 1) were first identified by a 15-state K-means PCA cluster analysis (presented in Supplemental Fig. 4A), then combined into five similarity groups (A–E) (see Methods). Other properties, shown in the remaining panels, were then assessed relative to these groups. Each column (panels 1 and 2) indicates average enrichment levels for a given histone modification or protein within the five groups (A–E). The color-coding for each group reflects the predominant patterns of “active” and “silent” marks (see text). Panels 3, 4, and 5 are as described above. The “chromosomes” panel shows the fold over-/under-representation of each group (log2 scale) relative to the amount of heterochromatin in each chromosome arm (h plus Het regions). The next two columns give the percentage of the group found in chromosome 4 (“% in chr4”), and the percentage of chromosome 4 that is accounted for by each group (“% of chr4”). “% in extensions” reports the percentage of each group present in the heterochromatin extensions (Fig. 3B; Table 1). See Supplemental Figure 4, B and C for the same analysis of the chromatin states in S2 cells. (C) An example of the interspersion of different chromatin states in the pericentric region of chromosome 2R. The region shows two transcribed genes (p120ctn and CG17486) within a heterochromatic context. The enrichment profiles of four marks are shown in black (y-axis: log intensity ratio values, x-axis: position on the chromosome), and the groups are illustrated as colored bars on the top. Genes are indicated in green with orientations indicated by the arrows. The upstream promoter regions of each gene are associated with the group D pattern (light-green; low H3K9me2 and me3, depletion of H4 and H1, and moderate HP1a enrichment). The regions immediately downstream from TSSs are associated with group C (dark green) and show enrichment in H3K4me2/3, H2B-ubi, along with low levels of HP1a and even lower levels of H3K9me2/3. The sequences within the body of the genes fall into group B (yellow), with strong enrichment for H3K36me3 along with HP1a and H3K9me2/3. The intergenic regions are associated with the group A pattern (red), showing enrichment only for H3K9me2/3 and HP1a. Group E describes a small group of loci under PC regulation.


