
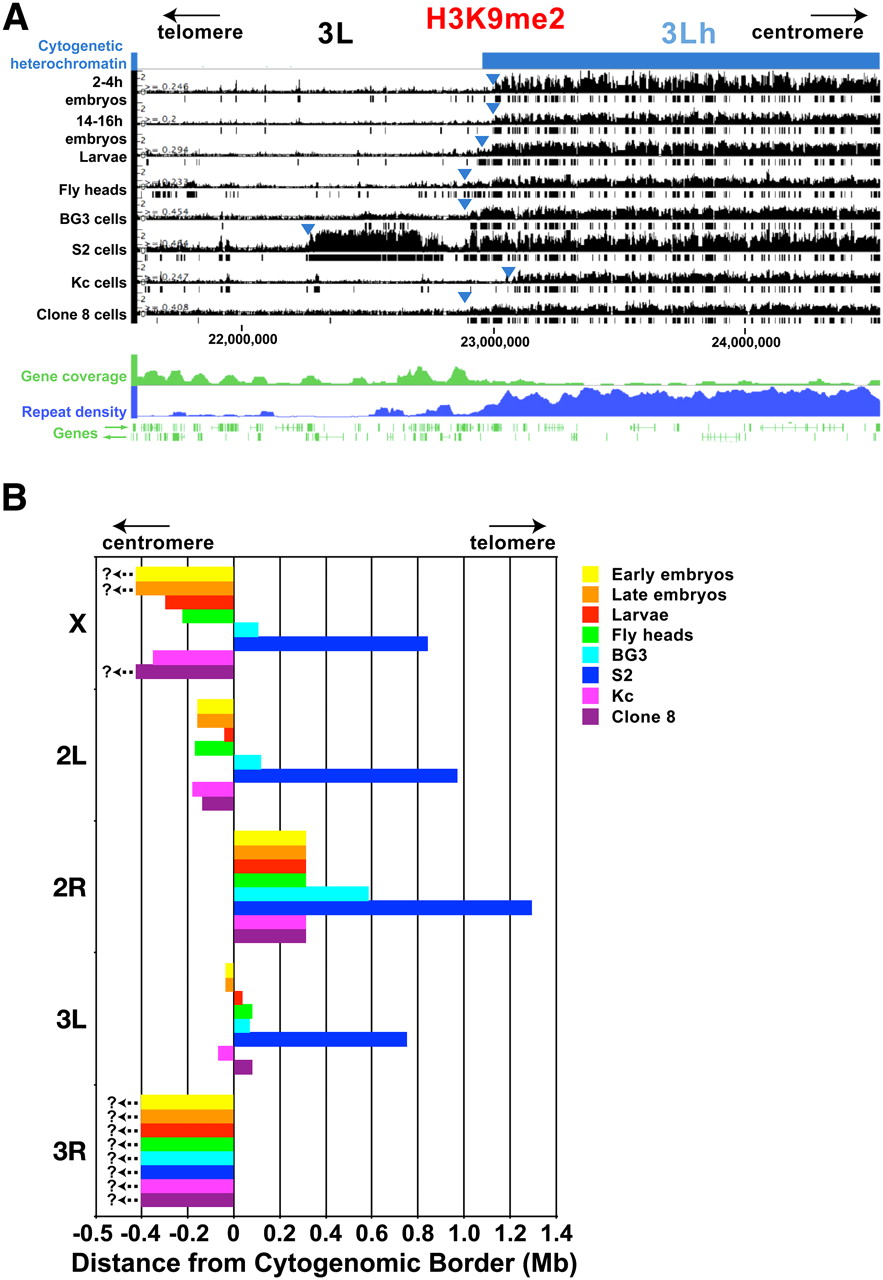
Heterochromatin–euchromatin borders differ among cell types. (A) H3K9me2 log intensity ratio values (y-axis) in the proximal region of chromosome arm 3L (x-axis, sequence coordinates in base pairs) are shown for 2–4-h embryos, 14–16-h embryos, third instar larvae, and adult heads, and for S2, BG3, Kc, and Clone 8 cells. Boxes below the bar graphs demarcate genomic regions with significant enrichment (0.1% FDR). The cytogenomically defined heterochromatin is shown in blue, and the blue arrowheads indicate the positions of the epigenomic border between euchromatin and heterochromatin. The “Repeat Density” track shows the fraction of each 10-kb window that consists of repeated DNAs, based on RepeatMasker (Release 3.28) (http://www.repeatmasker.org). “Gene coverage” plots the number of genes within 50-kb windows, and individual genes are shown below with their orientations as indicated by the arrows. (B) The barplot summarizes the positions of the epigenomic euchromatin–heterochromatin borders on each chromosome arm in the eight cell types examined. On the x-axis, 0 represents the positions of the cytogenomic borders; minus and plus numbers indicate that the epigenomic border was centromere-proximal or -distal to the cytogenomic border, respectively (in Mb). No enrichments for heterochromatic marks were observed for region 3Rh in any cell type, and for the X chromosome in three cell types (?<–), indicating that the borders lie in more proximal regions that are not in the current assemblies. Sequence coordinates of the epigenomic borders are shown in Table 1.


