
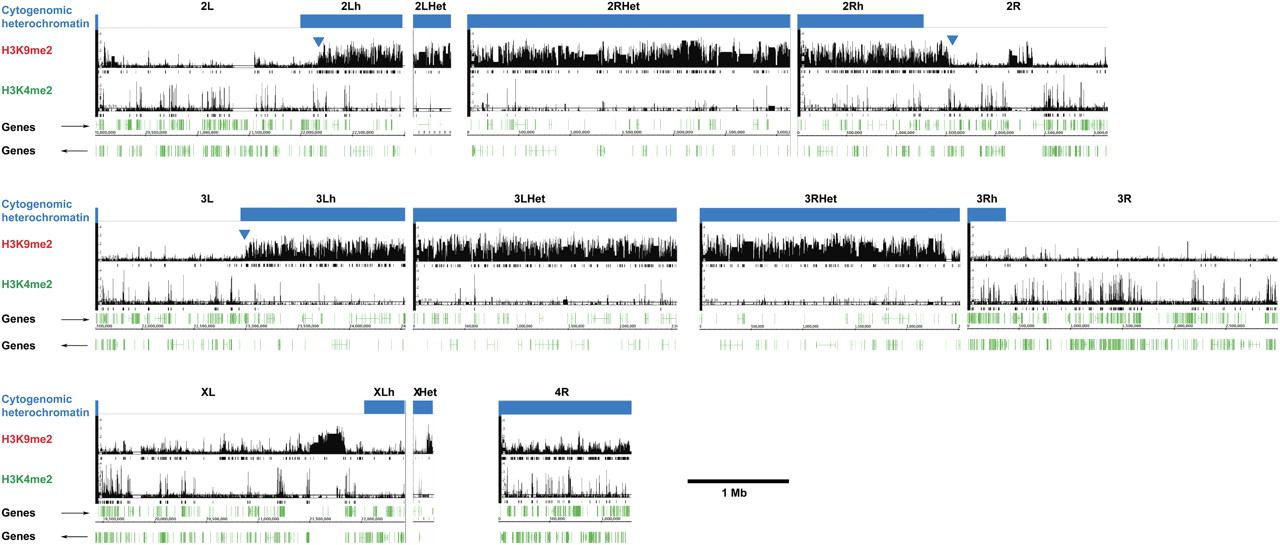
Chromatin marks define the epigenomic border between heterochromatin and euchromatin. Centromere-proximal euchromatin/heterochromatin borders were delineated based on ChIP-array data. Enrichments for H3K9me2 and H3K4me3 in 2–4-h embryos are shown for the centromere-proximal 3 Mb of chromosomes 2, 3, and X, as well as the distal portion of the 4th chromosome (1.35 Mb). The complete Het regions are shown also for chromosomes 2, 3, and X. Log intensity ratio values (y-axis) are plotted for each mark relative to the chromosomal position (x-axis). Boxes below the bar graph demarcate genomic regions with significant enrichment (0.1% false discovery rate [FDR]). Genes are shown in green below the ChIP-array data with their orientations as indicated by the arrows, and the cytogenomically defined heterochromatin is marked by a blue bar. The blue arrowheads indicate the positions of the epigenomic borders for chromosome arms 2L, 2R, and 3L. Patterns for multiple “silent” and “active” marks on chromosome arms 2R and 3L are shown in Supplemental Figure 1.


