
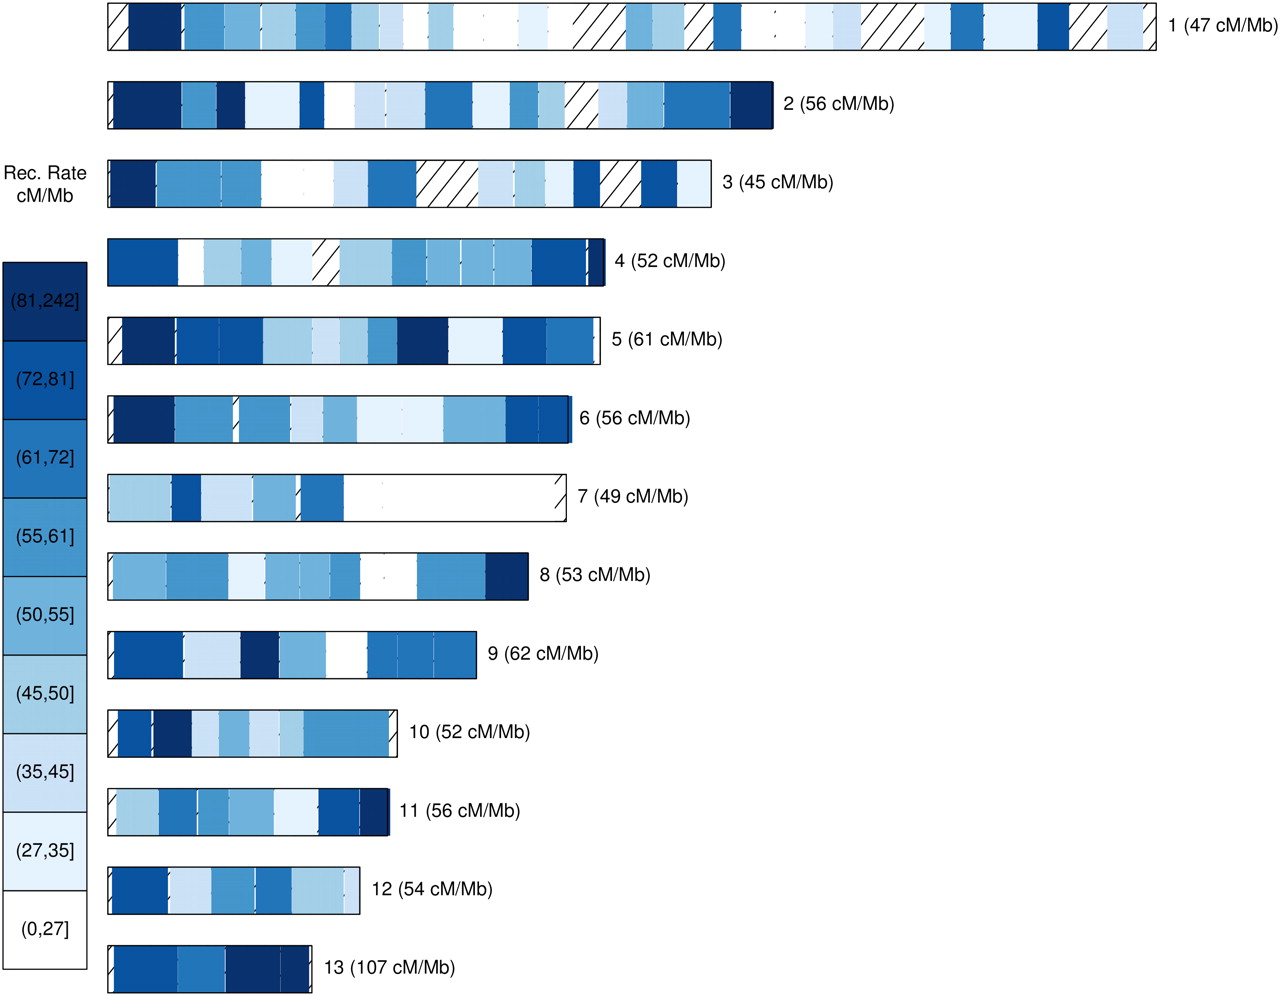
Recombination map of chromosomes 1–13 derived from coalHMM estimates of the parameter rho measured in units of substitutions. rho was estimated in windows of 100 kb along aligned chromosomes of four isolates: the M. graminicola reference genome, one genome of S1 and S2, and the outgroup sequence of S. passerinii. We converted rho to recombination rate measured in centimorgans per megabase (cM/Mb). Color differences indicate differences in recombination rate across chromosomes. The nine categories correspond to the nine quartiles of the observed distribution of recombination rate. Chromosome-wise values shown in parentheses are the median of all corresponding regions. Stripped regions show regions where rho could not be estimated due to insufficient alignment data.


