
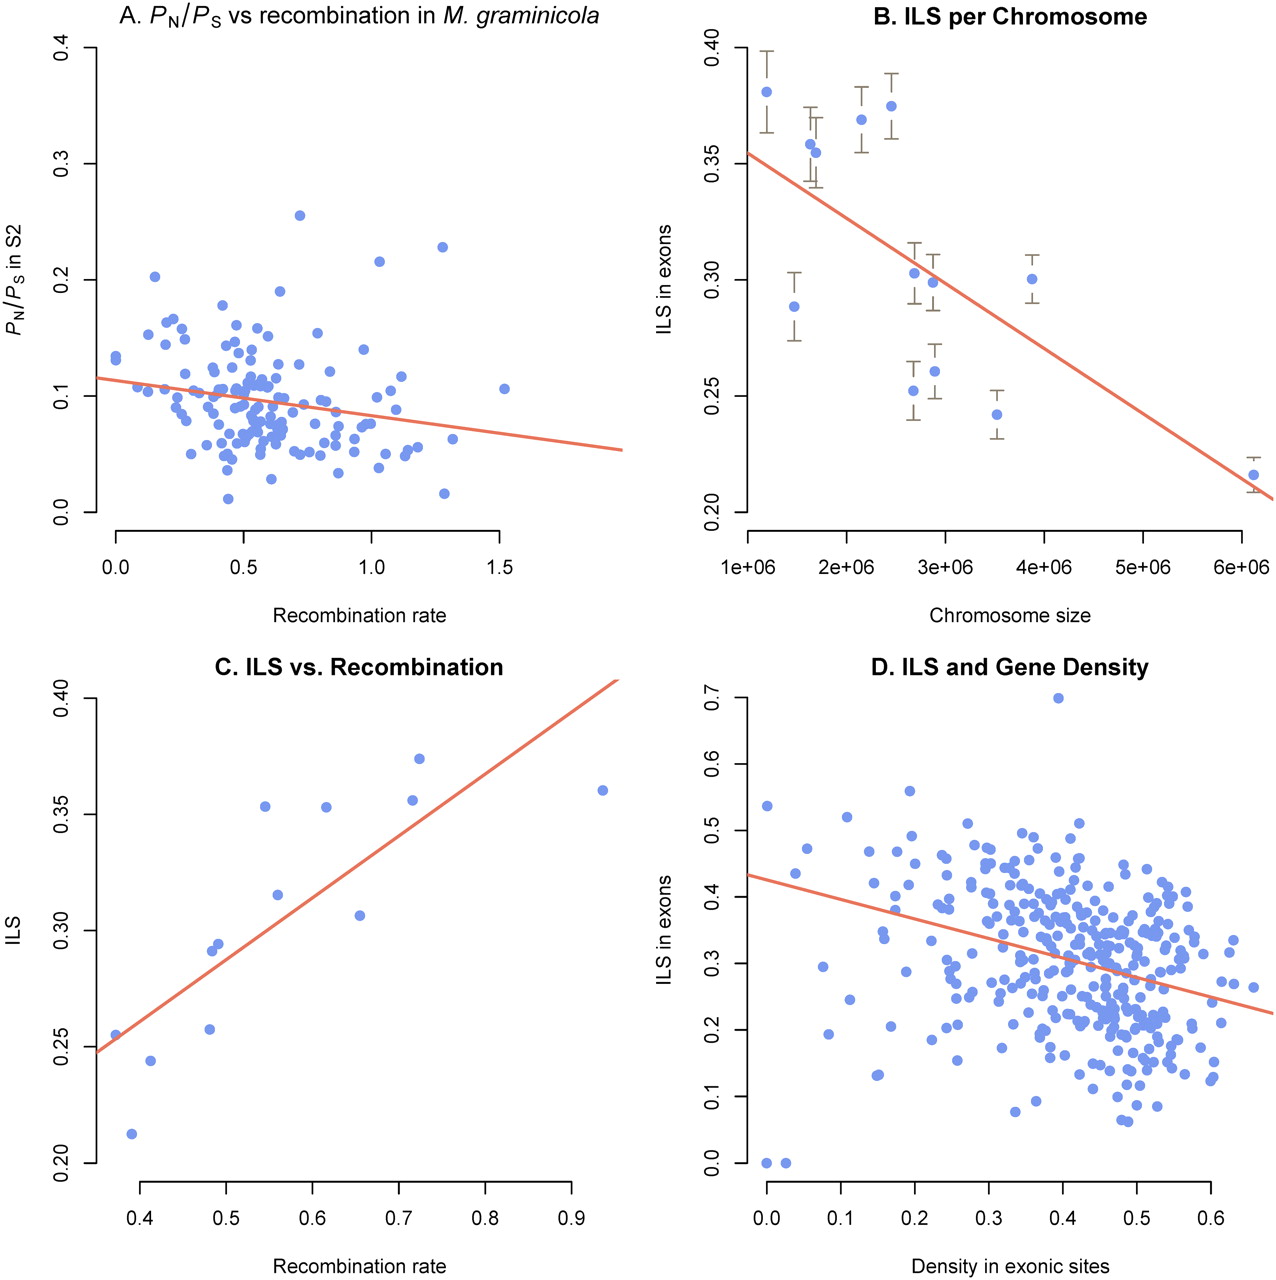
(A) Plot showing the negative correlation between PN/PS in M. graminicola and recombination rate. Both parameters were estimated as averages in windows of 100 kb (160 windows). One outlier window with an average value of PN/PS = 0.5 was excluded from the plot and regression analyses. (B) The frequency of incomplete lineage sorting (ILS) in exons plotted against chromosome size (chromosome 1–13) measured in base pairs. The strong negative correlation demonstrates a higher extent of ILS on smaller chromosomes reflecting the higher recombination rate on the smaller chromosomes. (C) Plot illustrating the positive correlation between the frequency of ILS on each essential chromosome (1–13) and average recombination rates for the same chromosomes. (D) The frequency of ILS in exonic sites plotted against exon density in 100-kb windows. The negative correlation illustrates that regions with a higher density of coding sites show less ILS compared to regions with fewer coding sites.


