
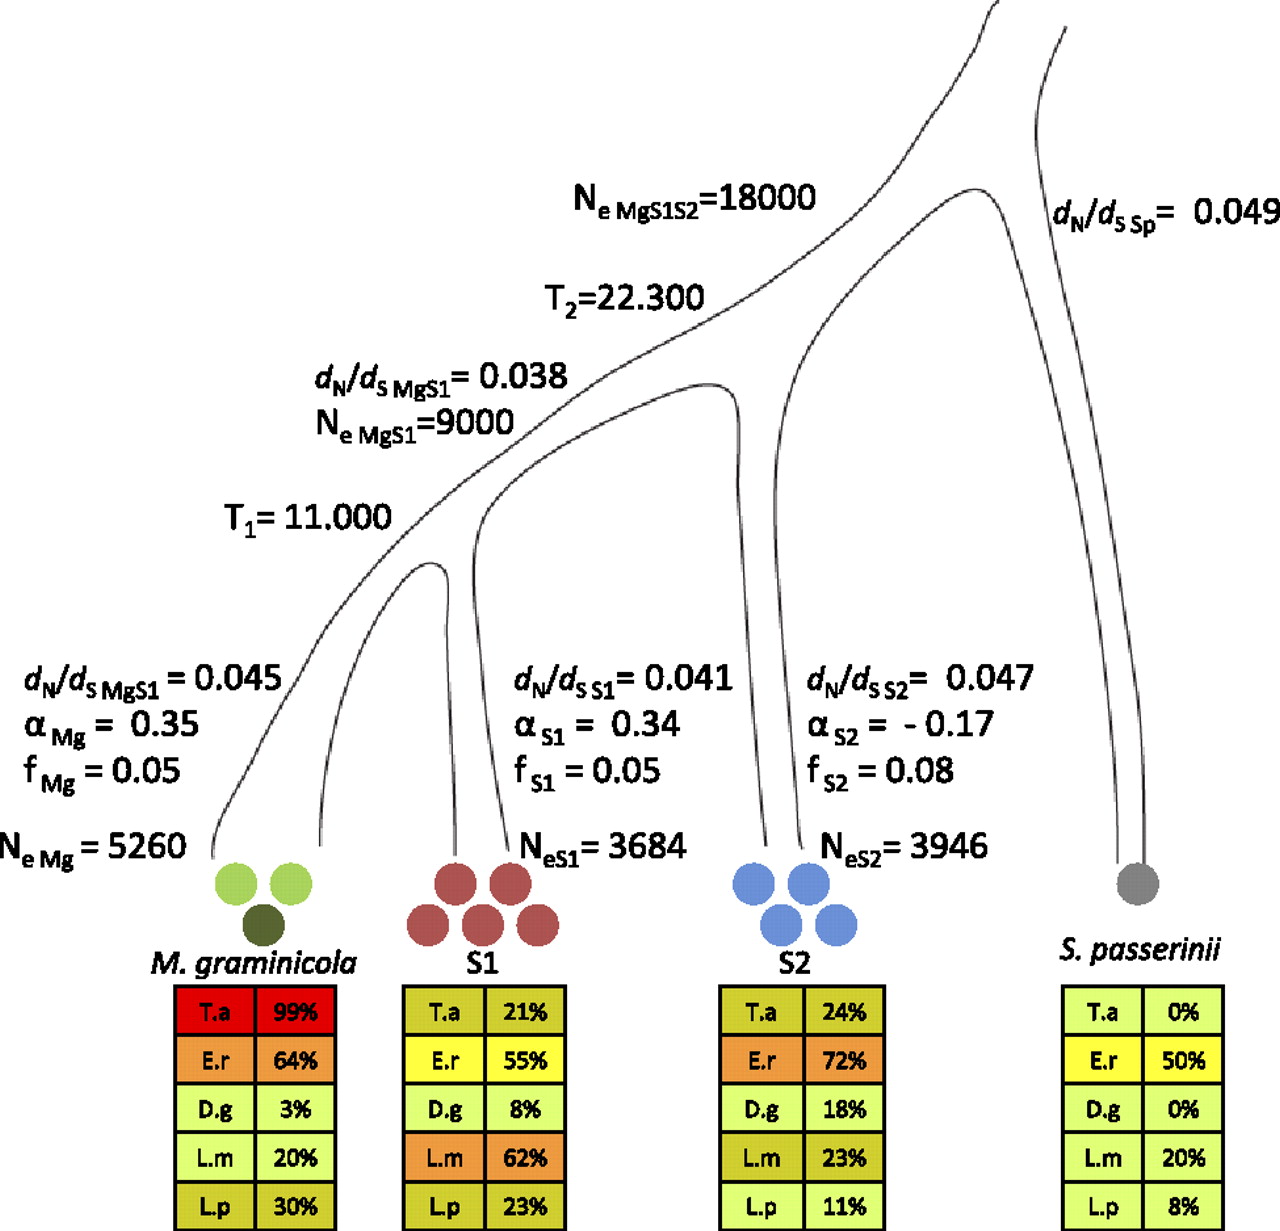
Species tree of M. graminicola, S1, S2, and S. passerinii. Circles indicate the number of genomes sequenced in each species. In our analyses we used the reference sequence of M. graminicola marked as a dark green circle. The lower panels of the figure summarize the ability of each species to infect the five grass species (T.a.) Triticum aestivum, (E.r.) Elymus repens, (D.g.) Dactylis glomerata, (L.m.) Lolium multiflorum, and (L.p.) Lolium perenne. The extent of host adaptation was estimated as percentage of leaf area covered by pycnidia among the different host species. Colors corresponding to the degree of infection are shown as 0%–20% (light green), 21%–40% (brownish green), 41%–60% (yellow), 61%–80% (orange), 81%–100% (red). We used a coalescence approach to estimate the split between M. graminicola and S1 (T1) and the more ancient split between S2 and the M. graminicola-S1 branch (T2). The population sizes of the ancestral species are indicated as NeMgS1 and NeMgS1S2 parameters. The evolutionary rate is estimated as the ratio of nonsynonymous to synonymous mutation rates dN/dS for each branch. Shown are also estimates of the parameter α quantifying the extent of adaptive evolution and the parameter f as a measure of the strength of purifying selection in each of the branches of M. graminicola, S1, and S2 using S. passerinii as the outgroup species. Contemporary effective population sizes were estimated from polymorphism data for each species and are given as NeMg, NeS1, and NeS2.


