
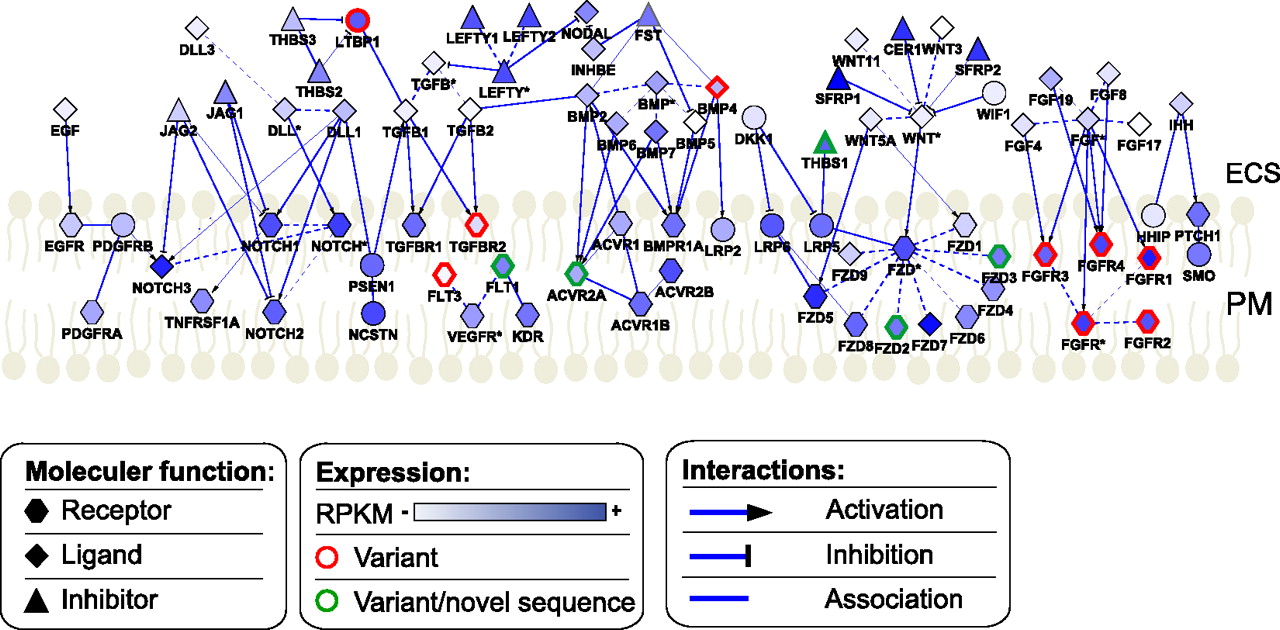
Transcriptional complexity for growth factor interaction model for pathways active on the hES cell surface. The model is based on KEGG pathway and IPA (Ingenuity Pathway Analysis, Ingenuity Systems) curated protein–protein interactions. Only genes enriched in the M/S fraction are shown because these are most likely to be actively translated. Nodes are colored according to M/S expression levels (RPKM). Node shape is dependent on molecular function according to IPA designation. Node outline color denotes the presence of at least two M/S-enriched alternatively spliced variants (red) or the presence of novel sequence feature(s) (green) for the gene in the M/S fraction. Interactions between genes (edges) are displayed for ligand–receptor (directed arrow), inhibitory action (directed inhibitory line), gene family member (dotted line), or non-directional interaction (solid line).


