
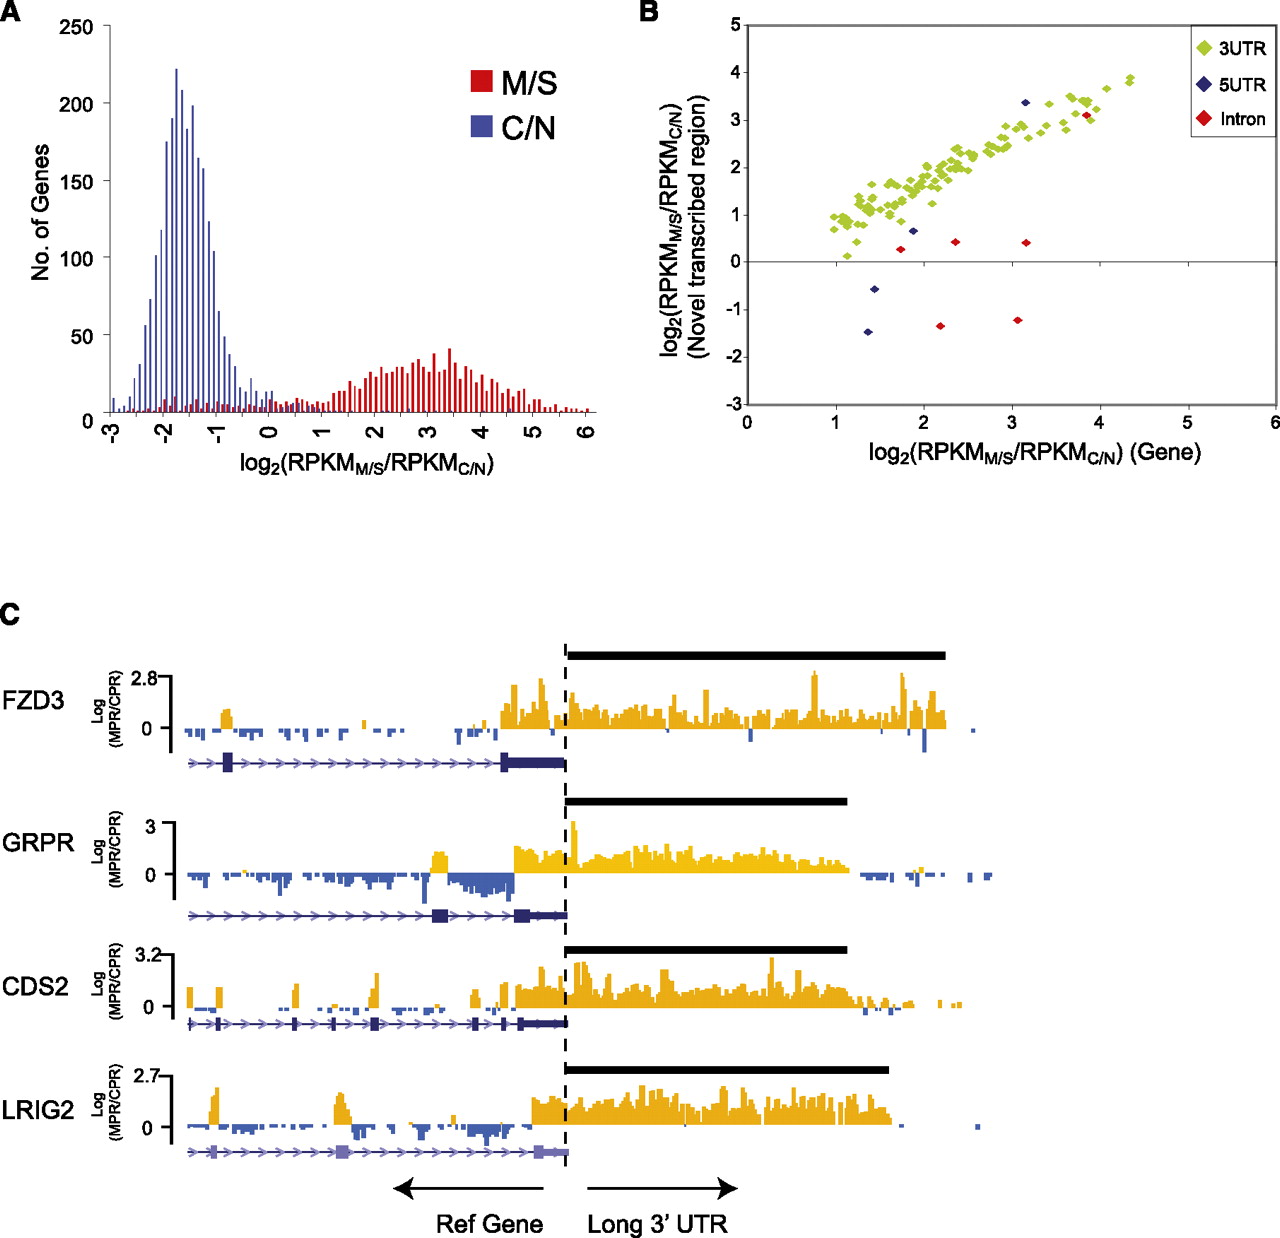
Enrichment of genes and alternative variants in the M/S enriched fraction. (A) Marked spatial separation of genes expressed in the membrane/secreted (M/S) and cytoplasmic/nuclear (C/N) fractions. The histogram shows frequency of genes expressed (RPKM > 1) plotted against the log2 ratio of M/S expression to C/N expression, log2(RPKMM/S/RPKMC/N). (B) Graph showing the correlation between canonical gene expression (x-axis) and expression of the novel annotated sequence (3′ UTR, 5′ UTR, intron retention; y-axis) for a subset of M/S genes. Notably, correlation with canonical gene expression is high for 3′ UTRs. (C) UCSC Genome Browser view of four genes for which novel long 3′ UTRs were detected by RNA-seq. Each track shows the log2 ratio of M/S to C/N expression calculated at 50-bp windows across the gene for the positive strand. (Orange) M/S-enriched regions; (blue) regions not enriched in M/S. Note the consistency of the M/S to C/S ratio across annotated 3′ UTRs, continuing through the length of the predicted novel 3′UTR.


