
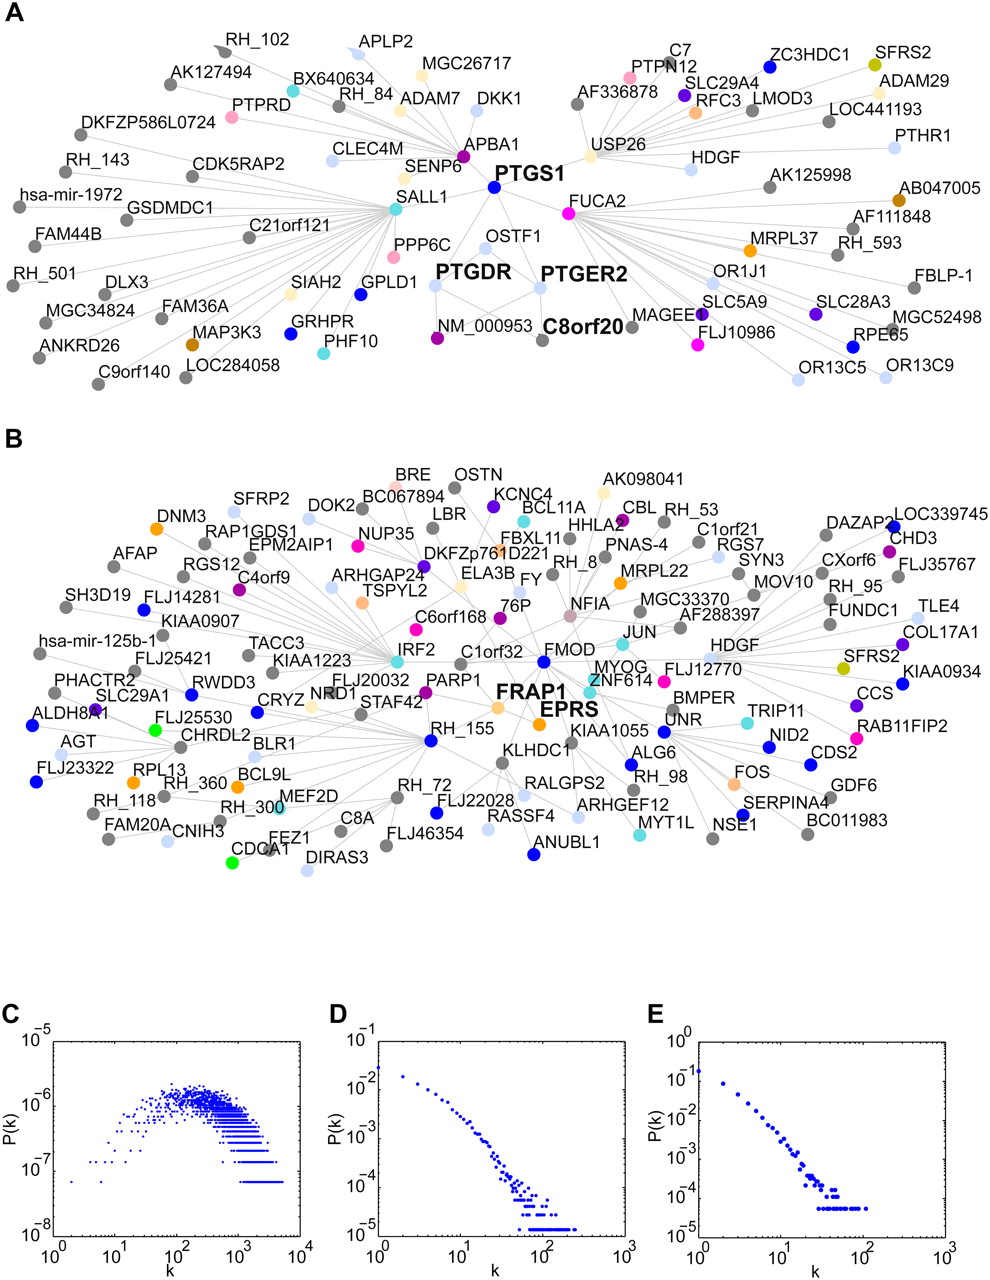
Figure 5.
Network topology. (A) Subnetwork of gene COX1 (PTGS1) and all genes up to two edges away at FDR <10−6. (B) Subnetwork of gene MTOR (FRAP1) and all genes up to three edges away at FDR <10−8. (C) Degree distribution of fully combined RH network at FDR <5%. Number of degrees, k, and point probability of node with k degrees, P(k), plotted on log scales. (D) Degree distribution of HPRD network. (E) Degree distribution of fully combined RH network at FDR <10−8.


