
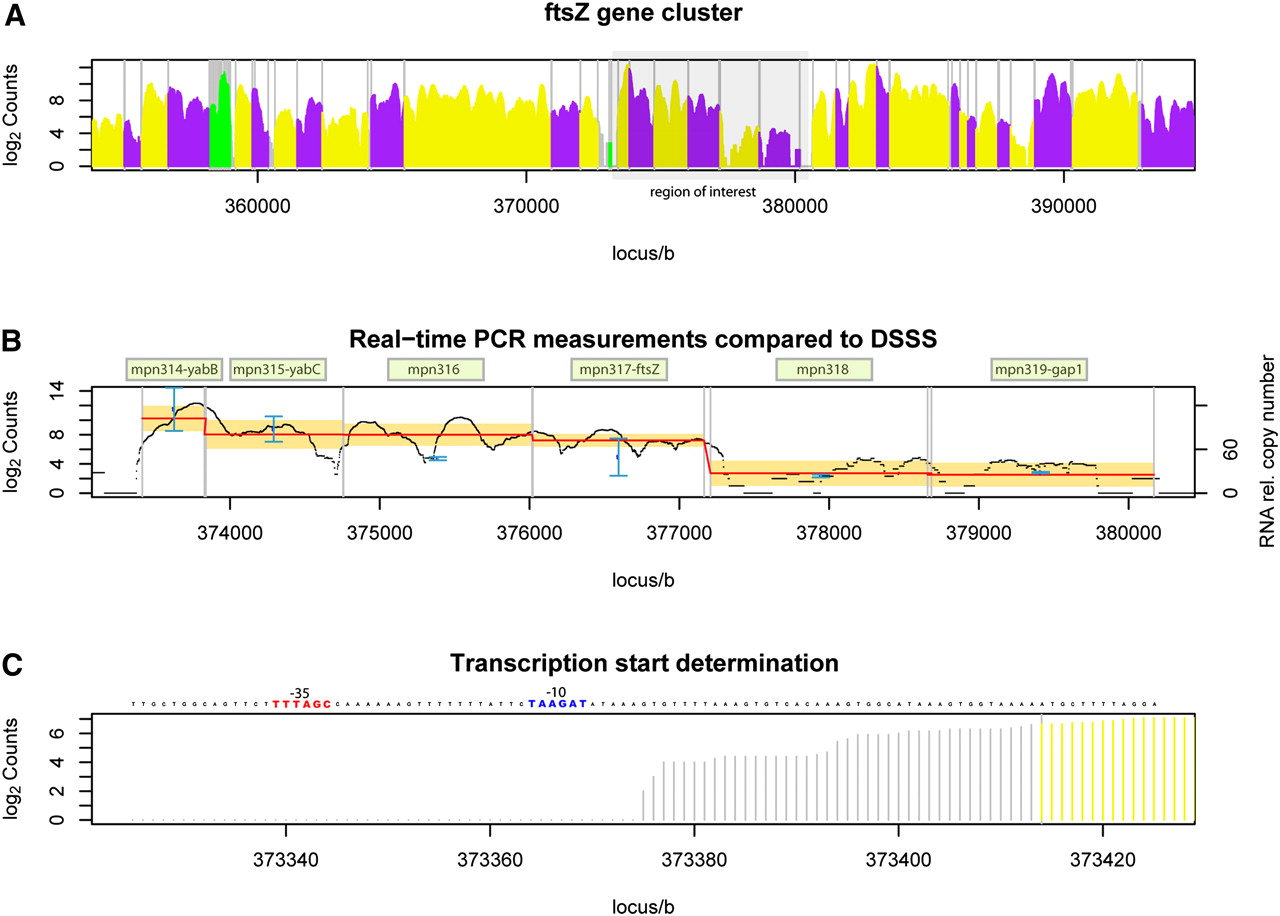
ftsZ gene cluster characterization. (A) Detection of transcription by DSSS in the interval between 355 kb and 395 kb on the forward strand of the M. pneumoniae M129 genome. Protein coding genes are alternately displayed in purple or yellow; genes encoding structural RNA are shown in green. Vertical gray lines separate annotated genes. The gray box at 373–380 kb highlights the ftsZ gene cluster. (B) Real-time PCR expression measurement compared to DSSS. Gene names are indicated in pale green boxes. Blue, transcript copy number estimated from RT-PCR (Benders et al. 2005); black, the DSSS signal; red, the average DSSS signal; orange, the confidence interval of gene expression (DSSS signal ± SD). Note that DSSS signal and RT-PCR measurements overlap in five of six genes. (C) Transcription start site determination with base-pair precision using DSSS. The first signal different from zero is used to determine the transcription start site. Blue, the predicted −10 region; red, −35 region. The result is in agreement with published results from Benders et al. (2005).


