
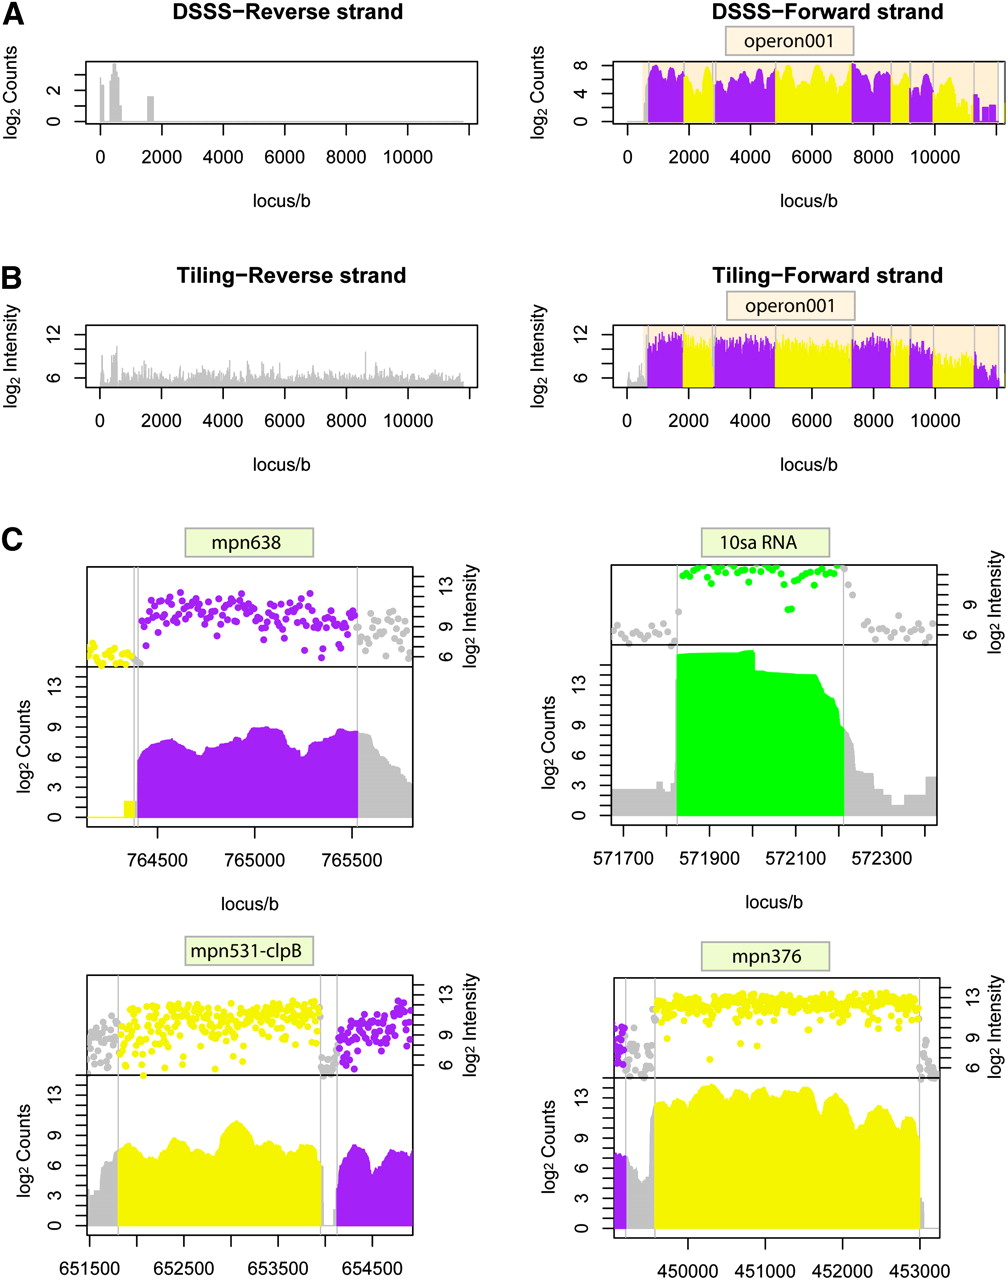
Visualization of the expression data collected from DSSS and tiling array data. Plots showing the transcription signals detected within genome coordinates 1–12,000 nt on the forward and reverse strand of the M. pneumoniae M129 genome. (A) DSSS deep sequencing data. (B) Tiling array data. Note the higher dynamic range and better signal/noise ratio of DSSS in comparison with tiling arrays. (C) Comparison of tiling array intensity signal and DSSS count (both on log2 scale) for Mycoplasma genes encoded on the forward or on the reverse strand. Transcript boundaries identified by DSSS do not show any systematic tendency compared with tiling arrays. mpn638: forward strand; 10sa RNA: forward strand; mpn531: reverse strand; mpn376: reverse strand. Purple/yellow, protein coding genes; green, RNA coding genes; gray, regions without annotated genes.


