
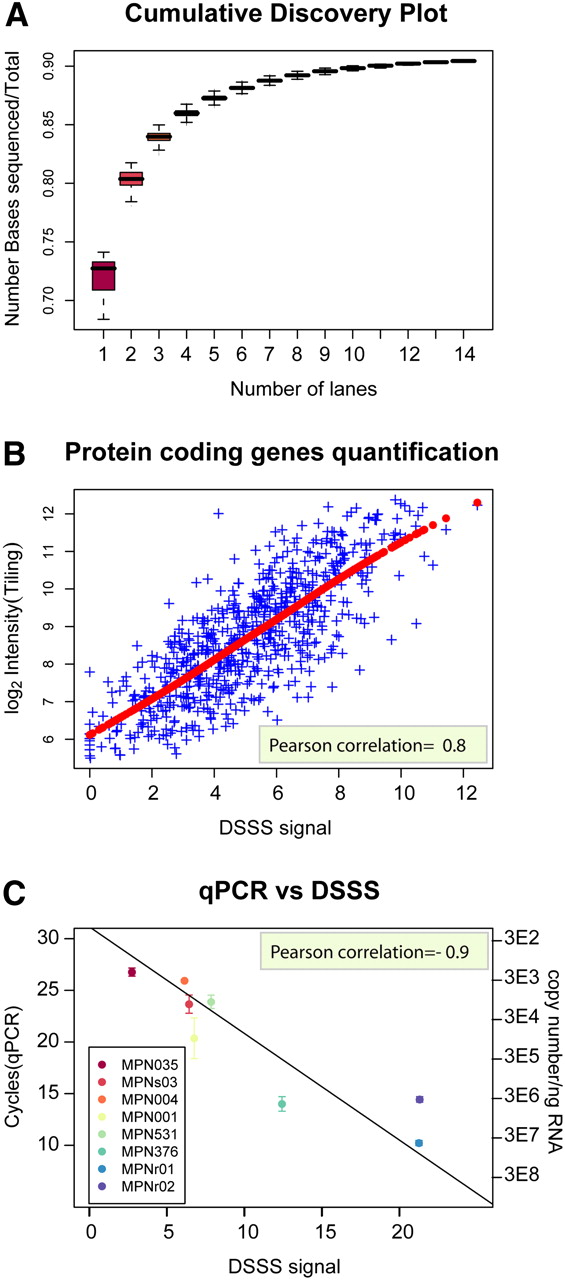
Comparative evaluation of deep sequencing. (A) Cumulative coverage of read data set, expressed as the ratio of sequenced bases located in annotated genes and the total number of bases in annotated genes. Exhaustive coverage is reached after 14 lanes (Supplemental Fig. 5). (B) Comparison of dynamic range of expression measurements (protein coding genes only) on tiling array and DSSS expressed on a log2 scale. (C) Validation of DSSS results using qPCR. DNase-treated RNA was reverse transcribed and subjected to SYBR green real-time PCR. Non-reverse-transcribed controls were included for each gene, as well as a genomic DNA dilution series. DSSS signal corresponds to the log2 transformed mean number of counts along the gene.


