
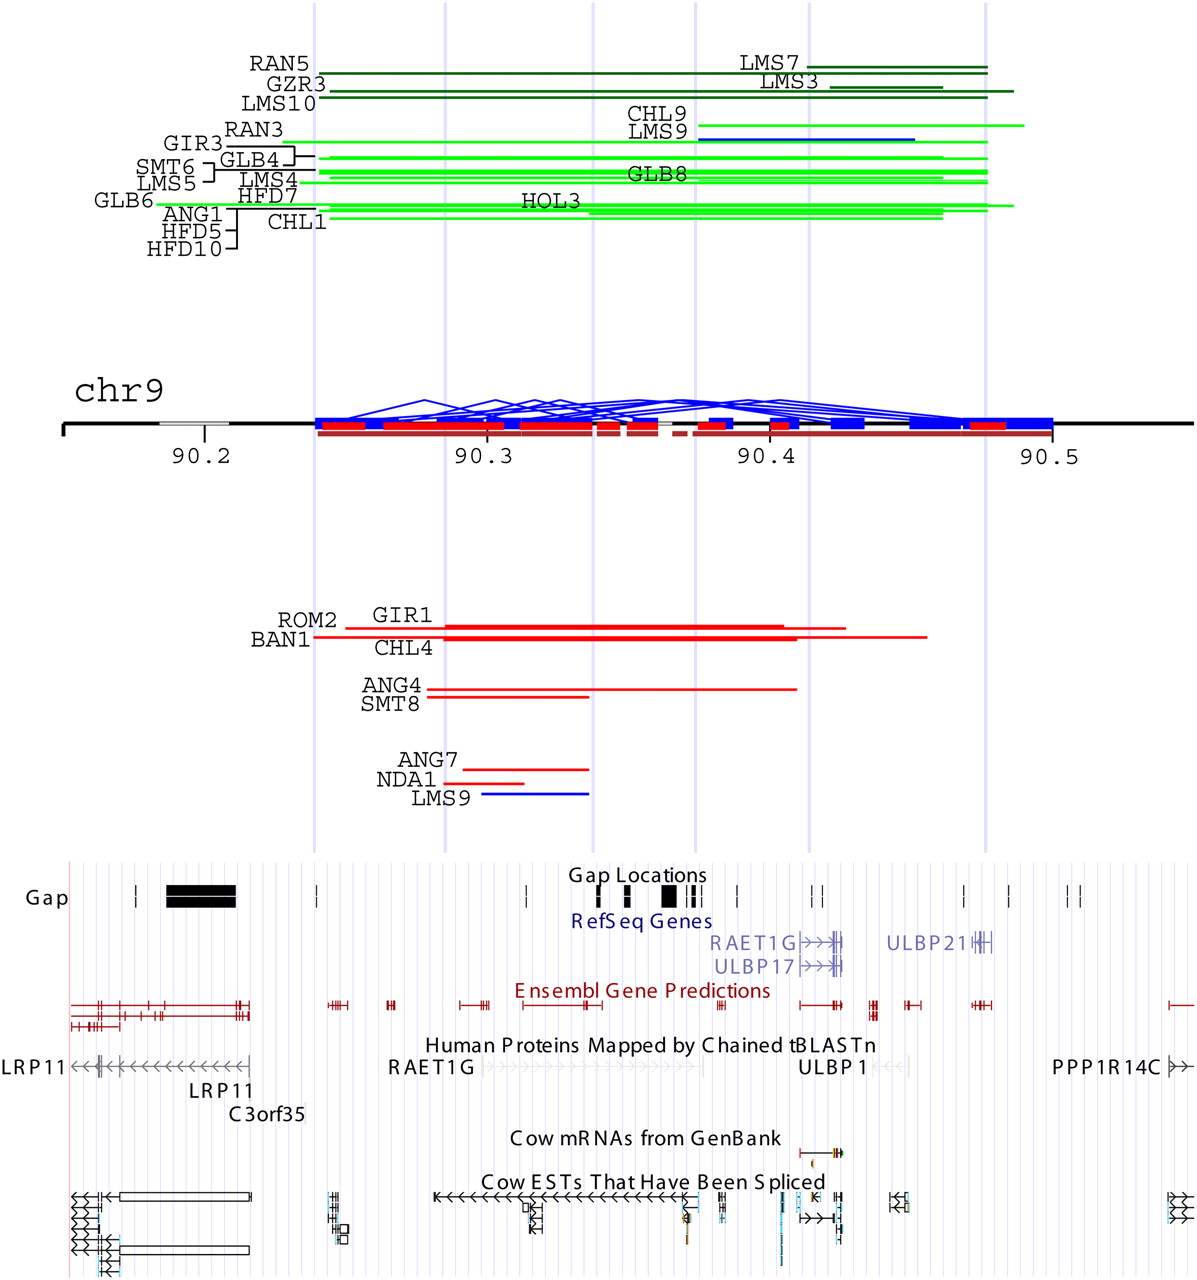
A detailed analysis of CNVR56 corresponding to the major ULBP gene cluster (chr9:90,150,000–90,550,000). On the chromosome, cattle SDs are predicted by WSSD (brown) and WGAC (blue and red represent intra- and interchromosomal WGAC duplications). Above chromosome are gain events (green = three copies and dark green = four copies), while below are loss events (one copy) of corresponding regions arranged vertically according to their relative log2 ratios from the chromosomal baseline. Limousin9 displays both loss and gain events (labeled as blue) within this region. The UCSC gene and expression tracks are shown at the bottom. Five light blue vertical lines represent potential breakpoint regions. ANG, Angus; BAN, Brangus; CHL, Charolais; GIR, Gir; GLB, Gelbvieh; GZR, Guzerat; HFD, Hereford; HOL, Holstein; LMS, Limousin; NDA, N'Dama; RAN, Red Angus; ROM, Romosinuano; and SMT, Simmental.


