
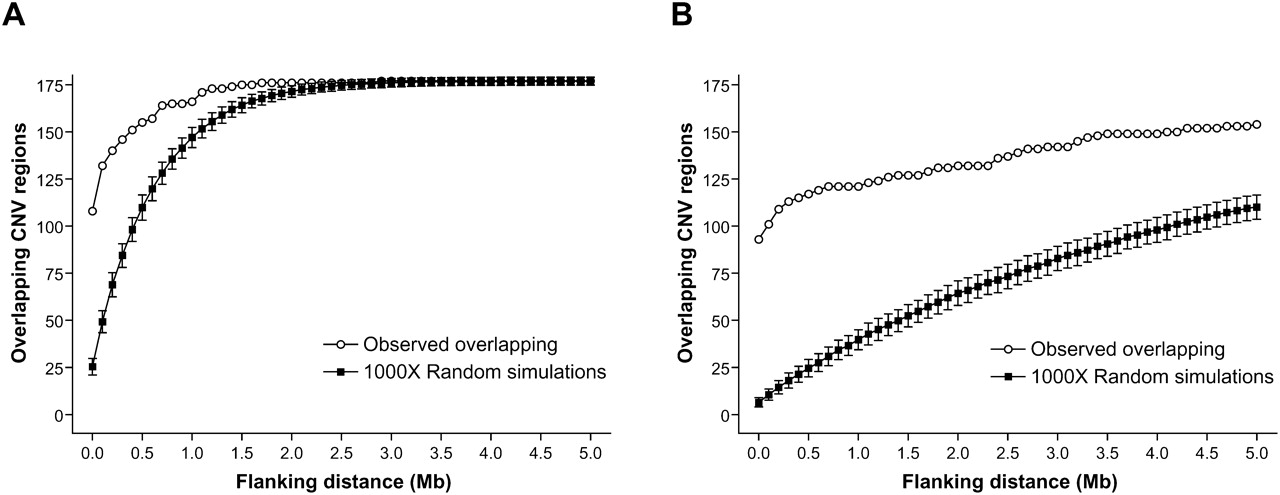
Figure 3.
Colocalization analysis of cattle CNV regions and segmental duplications. Relationships between flanking distances and numbers of cattle CNV regions overlapped with all SDs (A) or 1020 high-confidence SD regions (B).


