
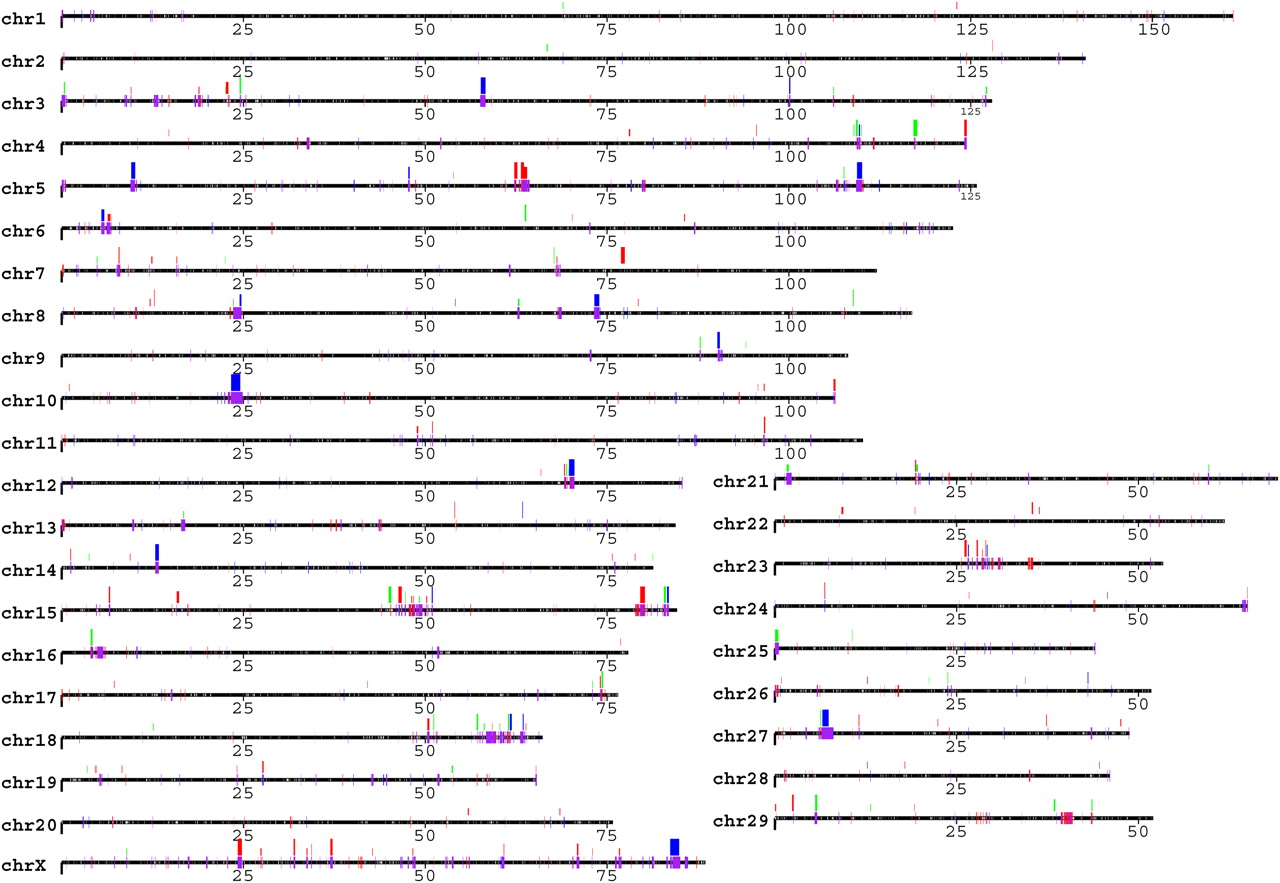
Cattle copy number variation and segmental duplication regions display a local tandem distribution pattern. CNV regions (177 events, 28 Mb, ∼1% of the bovine genome) reported by 90 array CGH experiments are shown above the chromosomes in green (gain), red (loss), and dark blue (both). The bar height represents their frequencies: short (appeared in 1 sample), median (≥2 samples), and tall (≥5 samples). Segmental duplications (94.4 Mb, 3.1% of the bovine genome) predicted by two independent computational approaches are illustrated on the chromosomes in red (WSSD), blue (WGAC), or purple (both). The patterns are depicted for all duplications for ≥5 kb in length and ≥90% sequence identity. The gaps in the assembly are represented on the chromosomes as white ticks. For clarity, distribution patterns with the unassigned sequence contigs (chrUnAll) are shown separately in Supplemental Figure S1.


