
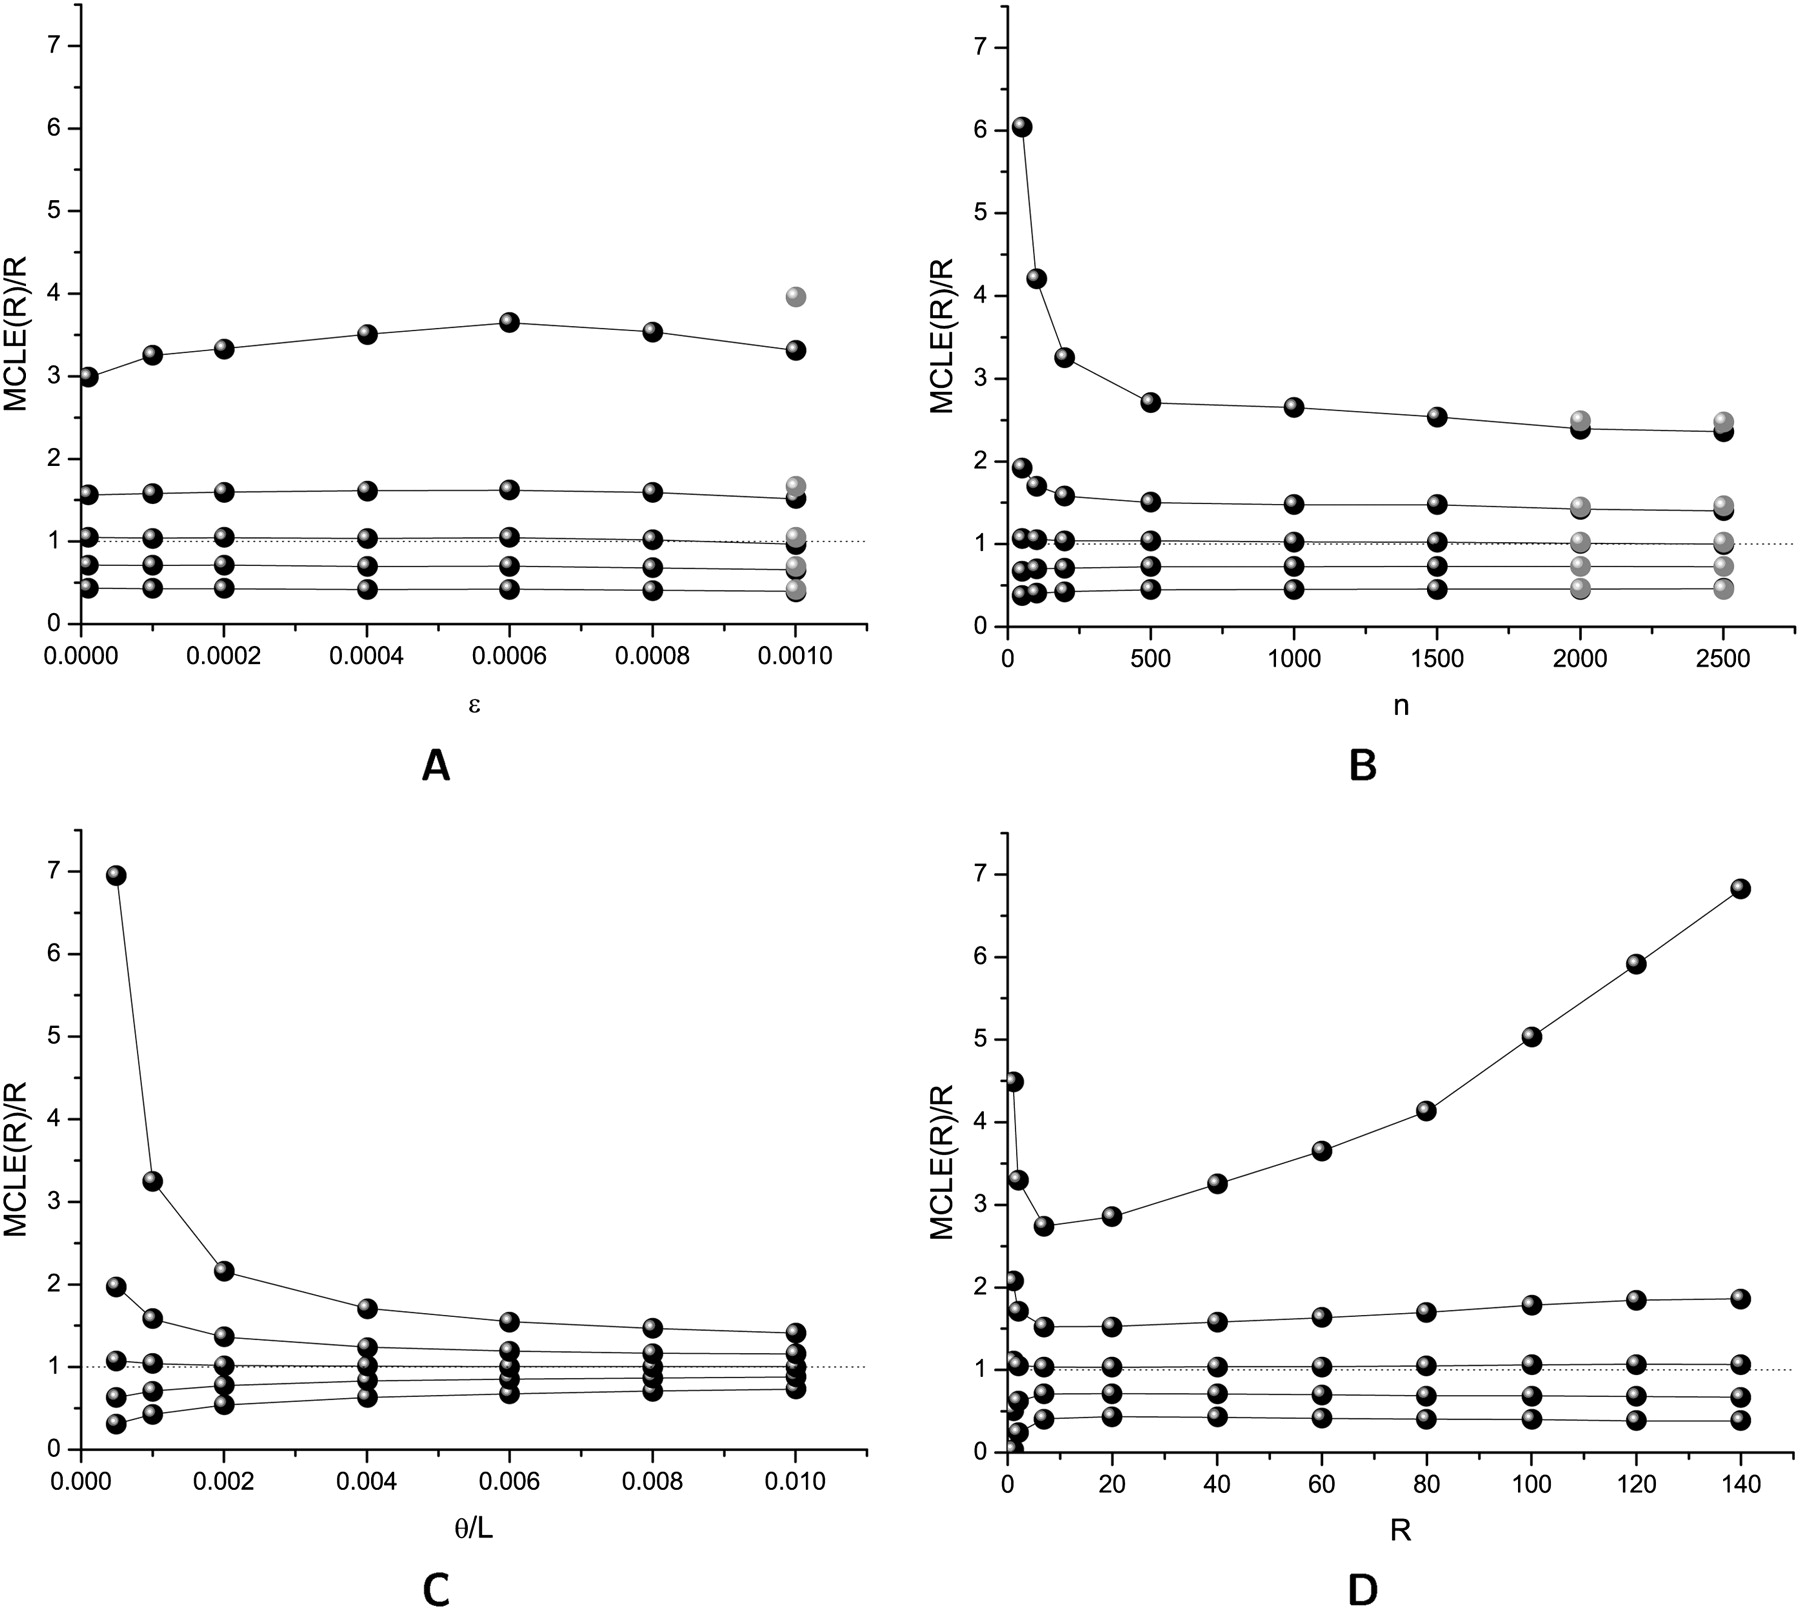
Figure 2.
Effects of ɛ (A), n (B), θ/L (C), and R (D) on the MCLE of R. The five point-and-lines (top to bottom) represent 95%, 75%, 50%, 25%, and 5% percentiles of the MCLE, respectively. Unless shown on the x-axis, ɛ = 10−4, n = 200, θ/L = 10−3, R = 40, and L = 104. Black dots were percentiles of MCLEs calculated with K = 3 and gray dots were percentiles of MCLEs calculated with K = 4.


