
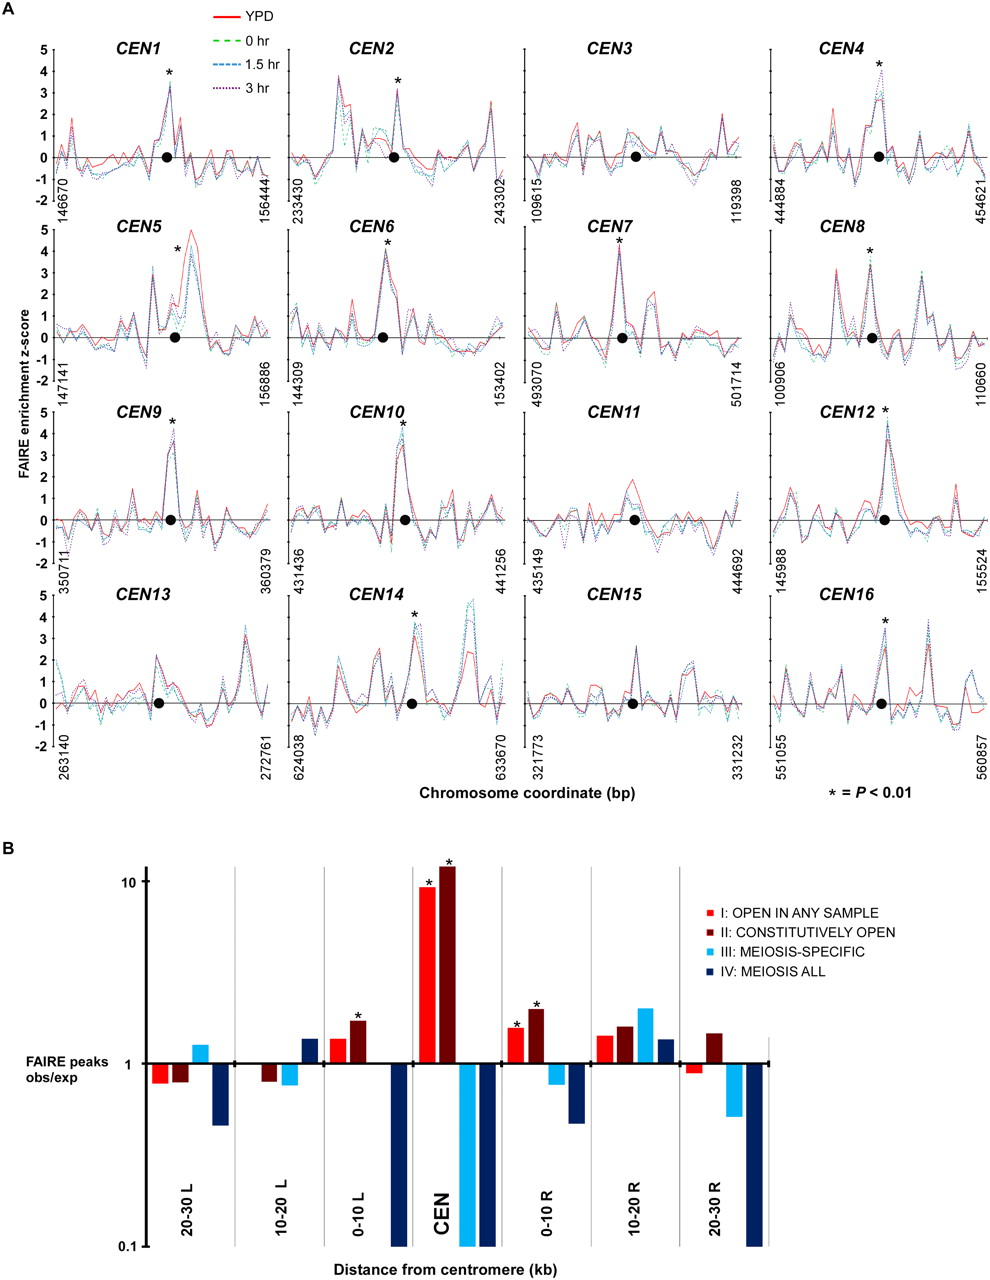
Centromeres and pericentromeric regions exhibit constitutively open chromatin. (A) FAIRE profiles of each of the 16 S. cerevisiae centromeres (CEN). Asterisks indicate sites significantly open at P < 0.01. Chromosomal coordinates are plotted on the x-axis and FAIRE enrichment is plotted on the y-axis. FAIRE data from YPD (red line), 0-h (green dashes), 1.5-h (blue dashes), and 3-h (purple dots) samples are plotted. (●) Centromeres. (B) Analysis of centromere-associated regions. The x-axis reports the region analyzed and the y-axis reports the ratio of observed sites of open chromatin to the expected number from random sampling. (Red) Category I; (maroon) category II; (light-blue) category III; (dark-blue) category IV sites.


