
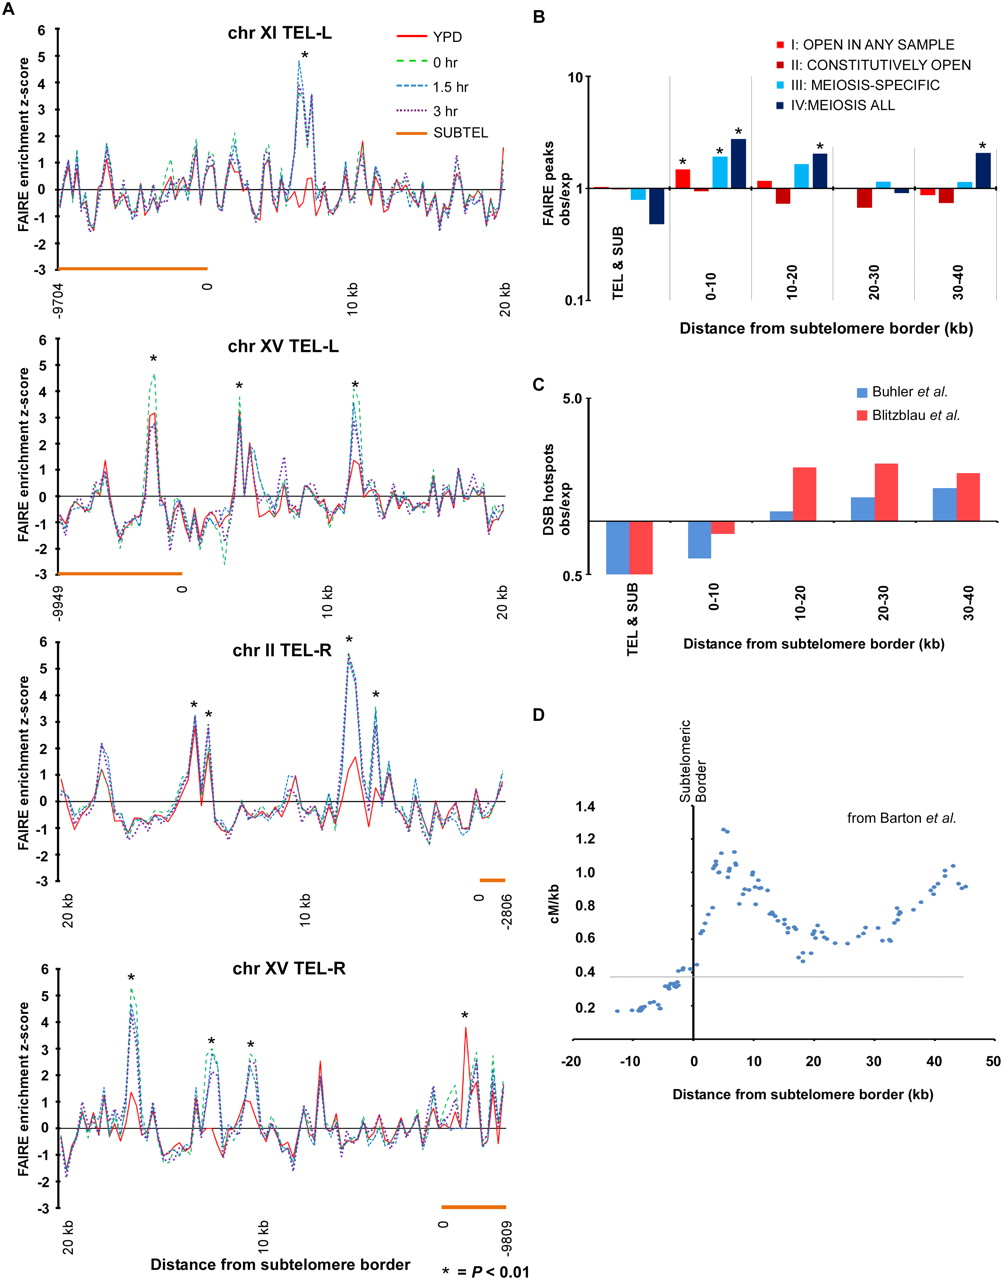
Regions proximally adjacent to the subtelomere borders exhibit meiosis-specific open chromatin. (A) Examples of meiosis-specific open chromatin at the subtelomeric borders. Distance from the subtelomeric border (coordinate 0) is plotted on the x-axis and FAIRE enrichment is plotted on the y-axis. Subtelomeres (orange bars) are shown. FAIRE data from YPD (red), 0-h (green), 1.5-h (blue dashes), and 3-h (purple dots) samples are plotted. Asterisks indicate sites significantly open (P < 0.01). (B) Analysis of telomeric regions. The x-axis reports the region analyzed and the y-axis reports the ratio of observed sites of open chromatin to the expected number from random sampling. (Red) Category I; (maroon) category II; (light-blue) category III; (dark-blue) category IV sites. The telomere and subtelomeres do not deviate from the genomic averages of expected/observed sites of open chromatin. Meiosis-specific open chromatin is most prominent in the 10 kb adjacent to the subtelomeres. In the 10–20-kb and 30–40-kb windows, only category IV sites are significantly above expected values. (C) The ratio of observed to expected number of DSB hotspots as plotted as a function from distance from the subtelomeric border. Data from Buhler et al. (2007) (blue) and Blitzblau et al. (2007) (red) are shown. (D) Recombination in the subtelomeric regions as measured by linkage mapping (Barton et al. 2008). Distance from the subtelomeric border is plotted on the x-axis and recombination rate (cM/kb) is shown on the y-axis. Recombination rates are presented as the average of the 15 reported rates closest to each position plotted. Subtelomeric regions are defined as having either >50% DNA sequence identity to another region of the genome or as having <60% nondubious ORFs using a 20-kb sliding window (Barton et al. 2008). The subtelomeric border is the point at which neither of these criteria is met. The gray line represents the genomic average recombination rate of 0.37 cM/kb (Barton et al. 2008).


