
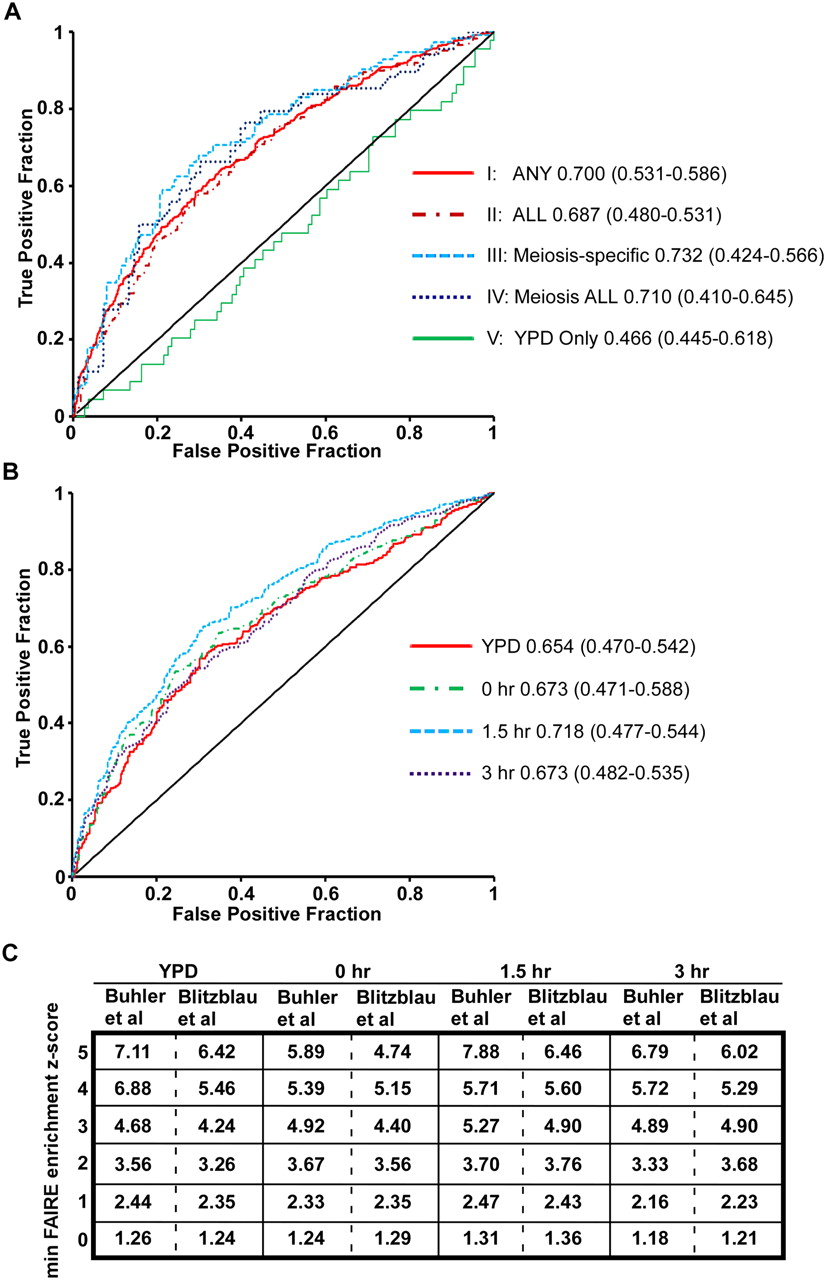
The degree of chromatin openness is predictive of DSB hotspots. (A) ROC curve analysis of the five categories of open chromatin. True-positives and false-positives are defined with respect to DSB hotspots (Buhler et al. 2007) (Methods). The FAIRE sites plotted are ordered such that those to the left are most open according to FAIRE (lowest P-value), and those to right, while still significantly open, have higher P-values. Data from category I (solid red), category II (maroon dashes), category III (light-blue dashes), category IV (dark-blue dots), and category V sites (solid green) are plotted. AUC values are listed next to the sample name, and the minimum and maximum AUC values of the random permutations follow in parentheses. (B) ROC curve analysis of sites of open chromatin in individual time points. Data from YPD (red), 0-h (green dashes), 1.5-h (light-blue dashes), and 3-h (purple dots) samples are plotted. (C) DSB predictive value of individual probes with FAIRE z scores above the indicated threshold, expressed as likelihood ratios. Values in the table are TPF/FPF at decreasing z score thresholds, listed vertically on the left. Time points are organized on the horizontal axis. Predictive value is expressed with respect to two DSB hotspot datasets (Blitzblau et al. 2007; Buhler et al. 2007). Because this analysis is probe based, multiple true-positives may be derived from a single DSB hotspot.


