
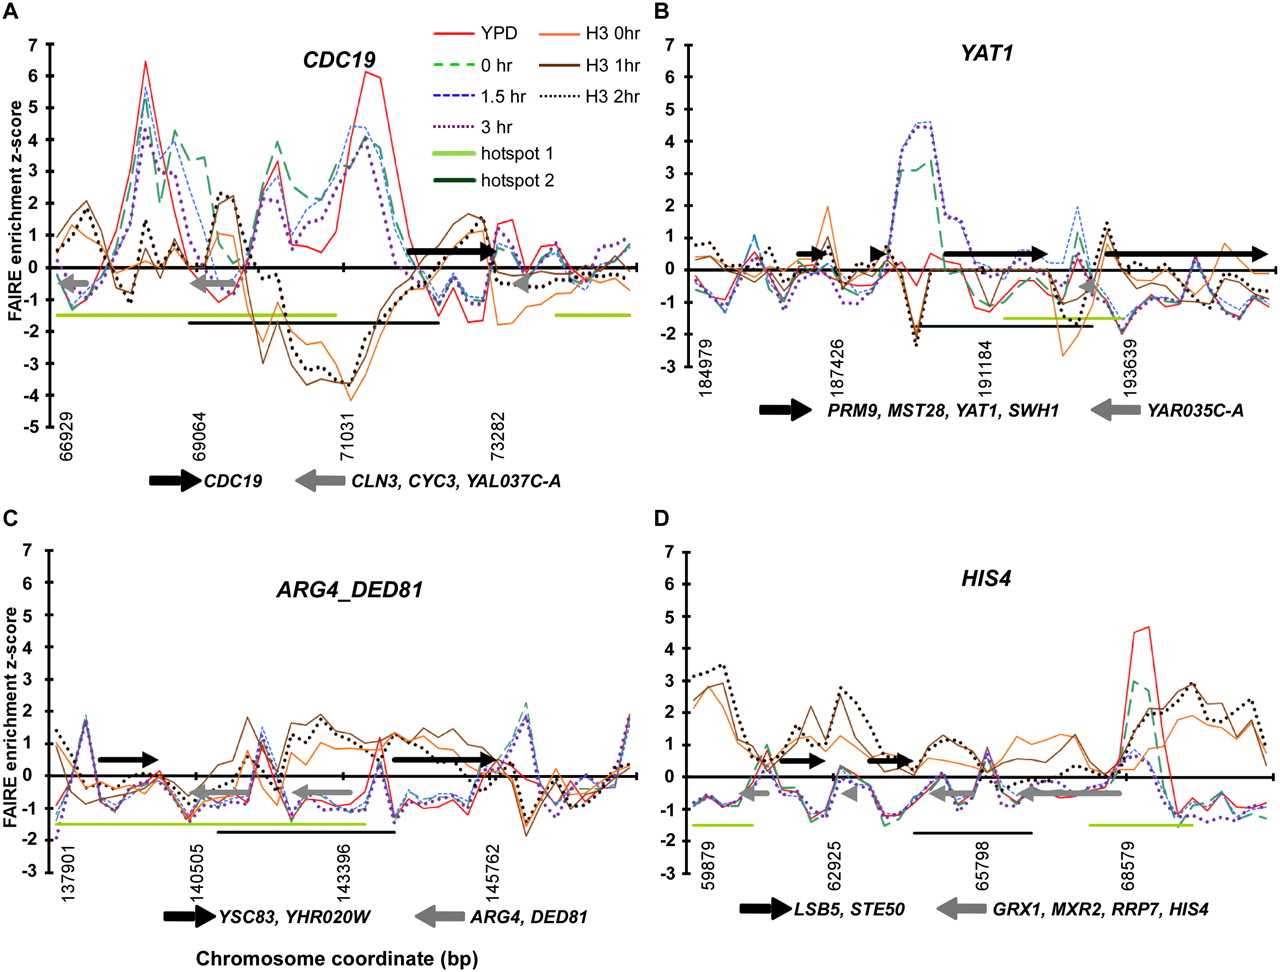
Chromatin at known hotspots is dynamic. Chromosome coordinates are plotted along the x-axis, with FAIRE enrichment (z score) plotted on the y. Positive z scores indicate relatively open chromatin, and negative numbers indicate relatively closed chromatin. FAIRE data from YPD (red), 0-h (dashed green), 1.5-h (blue fine dashes), and 3-h (purple and dotted) samples are plotted. Among the 1204 sites, 151 were open in all the meiosis samples (1.5 and 3 h), but not during mitotic growth (e.g., YAT1). Conversely, 156 sites were open during mitotic growth, but were not open in any of the meiotic samples. Meiotic histone H3 ChIP-chip data from 0 h (orange), 1 h (brown), and 2 h (dark brown and dotted) are plotted (Borde et al. 2009). Hotspot regions identified by Buhler et al. (2007) (light-green bars), and by Blitzblau et al. (2007) (dark-green bars) are shown. Arrows represent the coding regions of genes, with those above the x-axis coded from the Watson strand and those below coded from the Crick strand. (A) Chromatin dynamics at the CDC19 hotspot on chromosome I, an example of a hotspot with constitutively open chromatin. (B) Chromatin dynamics at the YAT1 hotspot on chromosome I, an example of a meiosis-specific site of open chromatin. (C) Chromatin dynamics at the ARG4_DED81 hotspot on chromosome VIII (Wu and Lichten 1994; Ohta et al. 1999), an example of a DSB hotspot with no observed open chromatin in any sample. (D) Chromatin dynamics at the HIS4 hotspot on chromosome III, an example of a hotspot at which the chromatin is open in YPD and closes as meiosis progresses.


