
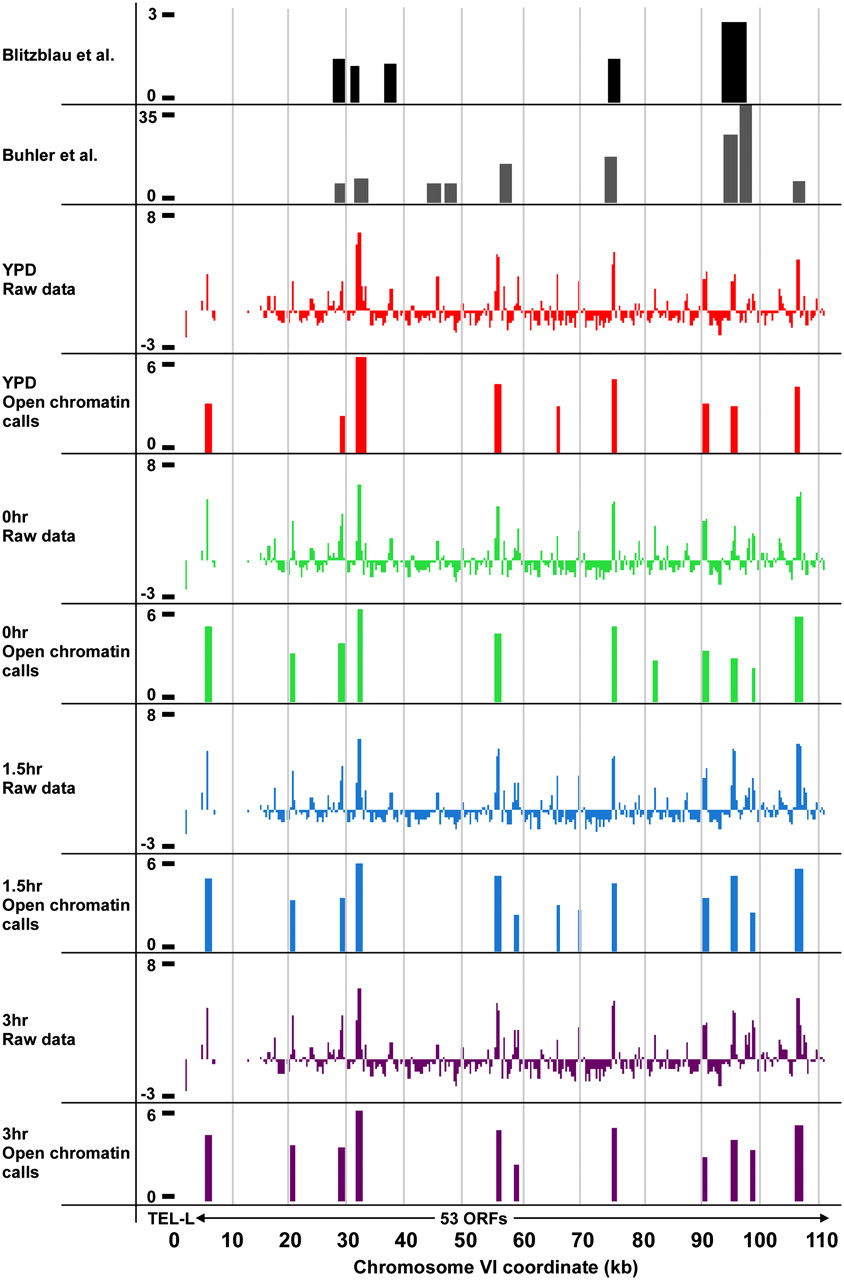
Figure 2.
The distribution of open chromatin and DSB hotspots across a representative 110-kb genomic region containing 53 genes. Chromosome coordinates are plotted along the x-axis, with FAIRE enrichment (z score) plotted on the y. FAIRE data were loaded into the UCSC Genome Browser along with published DSB hotspots (black and dark gray) (Blitzblau et al. 2007; Buhler et al. 2007). FAIRE data from YPD (red), 0-h (green), 1.5-h (blue), and 3-h (purple) samples are plotted.


