
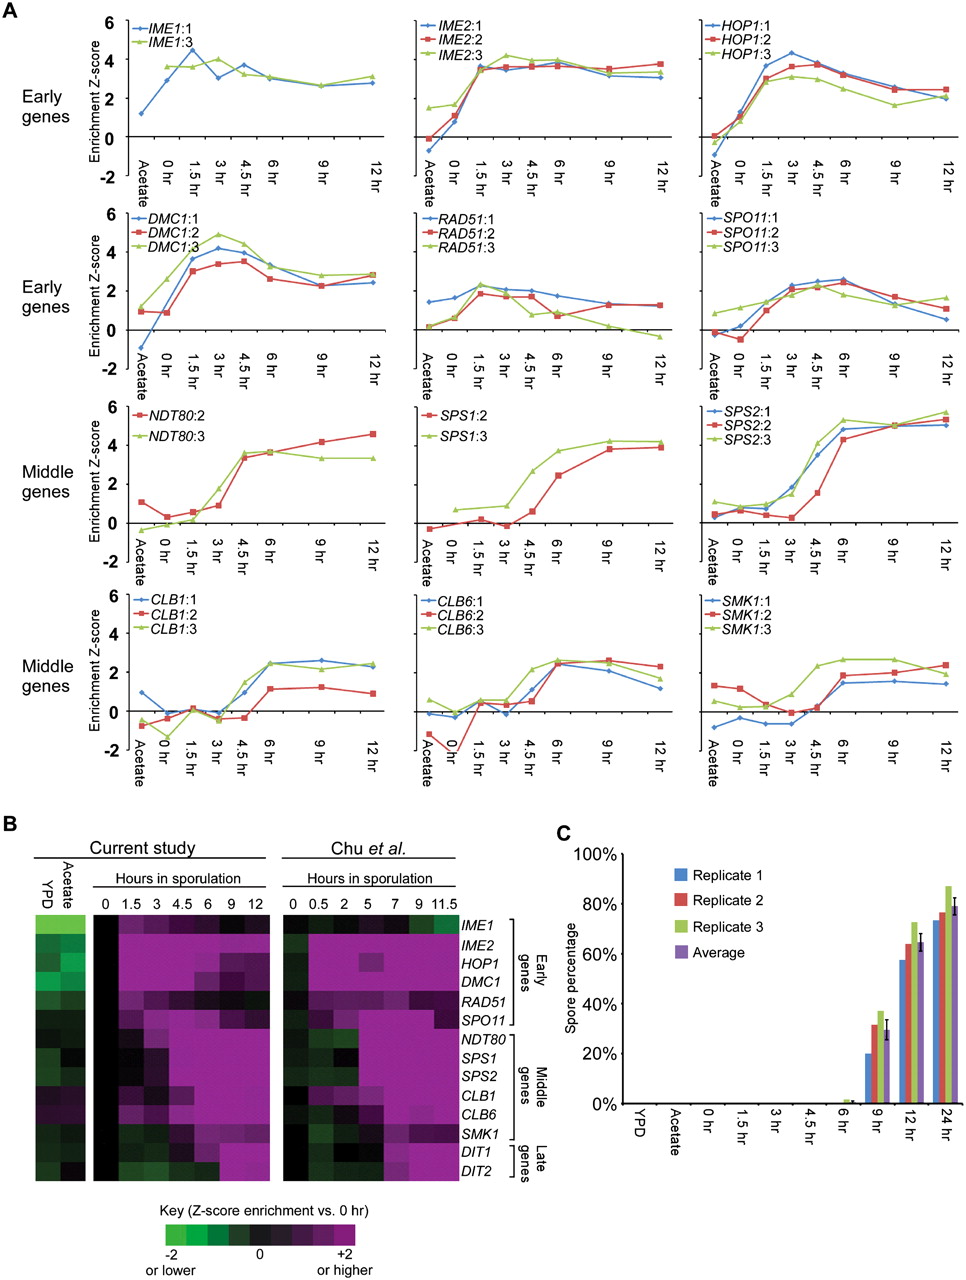
Monitoring meiotic entry and progression in the time course used for FAIRE. (A) To validate meiotic entry and synchrony in each biological replicate, we analyzed the transcription profiles of key meiotic progression genes by expression microarray. Time point is indicated on the x-axis, and expression relative to YPD is shown on the y. Biological replicates are plotted (1, blue; 2, red; 3, green). If only two samples are shown, the YPD probe was flagged for technical reasons, and thus no comparisons could be made. Early meiotic genes include IME1, IME2, HOP1, DMC1, RAD51, and SPO11. Middle meiotic genes include NDT80, SPS1, SPS2, CLB1, CLB6, and SMK1. (B) Comparison to meiotic transcription microarray data of Chu et al. (1998). Purple indicates positive meiotic enrichment, and green indicates negative meiotic enrichment. Transcription data is represented as a ratio between time point expression and 0 h expression. (C) Completion of meiosis as measured by spore counts. Spore counts were taken at each time point. Time point is indicated on the x-axis, and the percentage of sporulated cells is indicated on the y. Biological replicates are plotted (1, blue; 2, red; 3, green; average, purple).


