
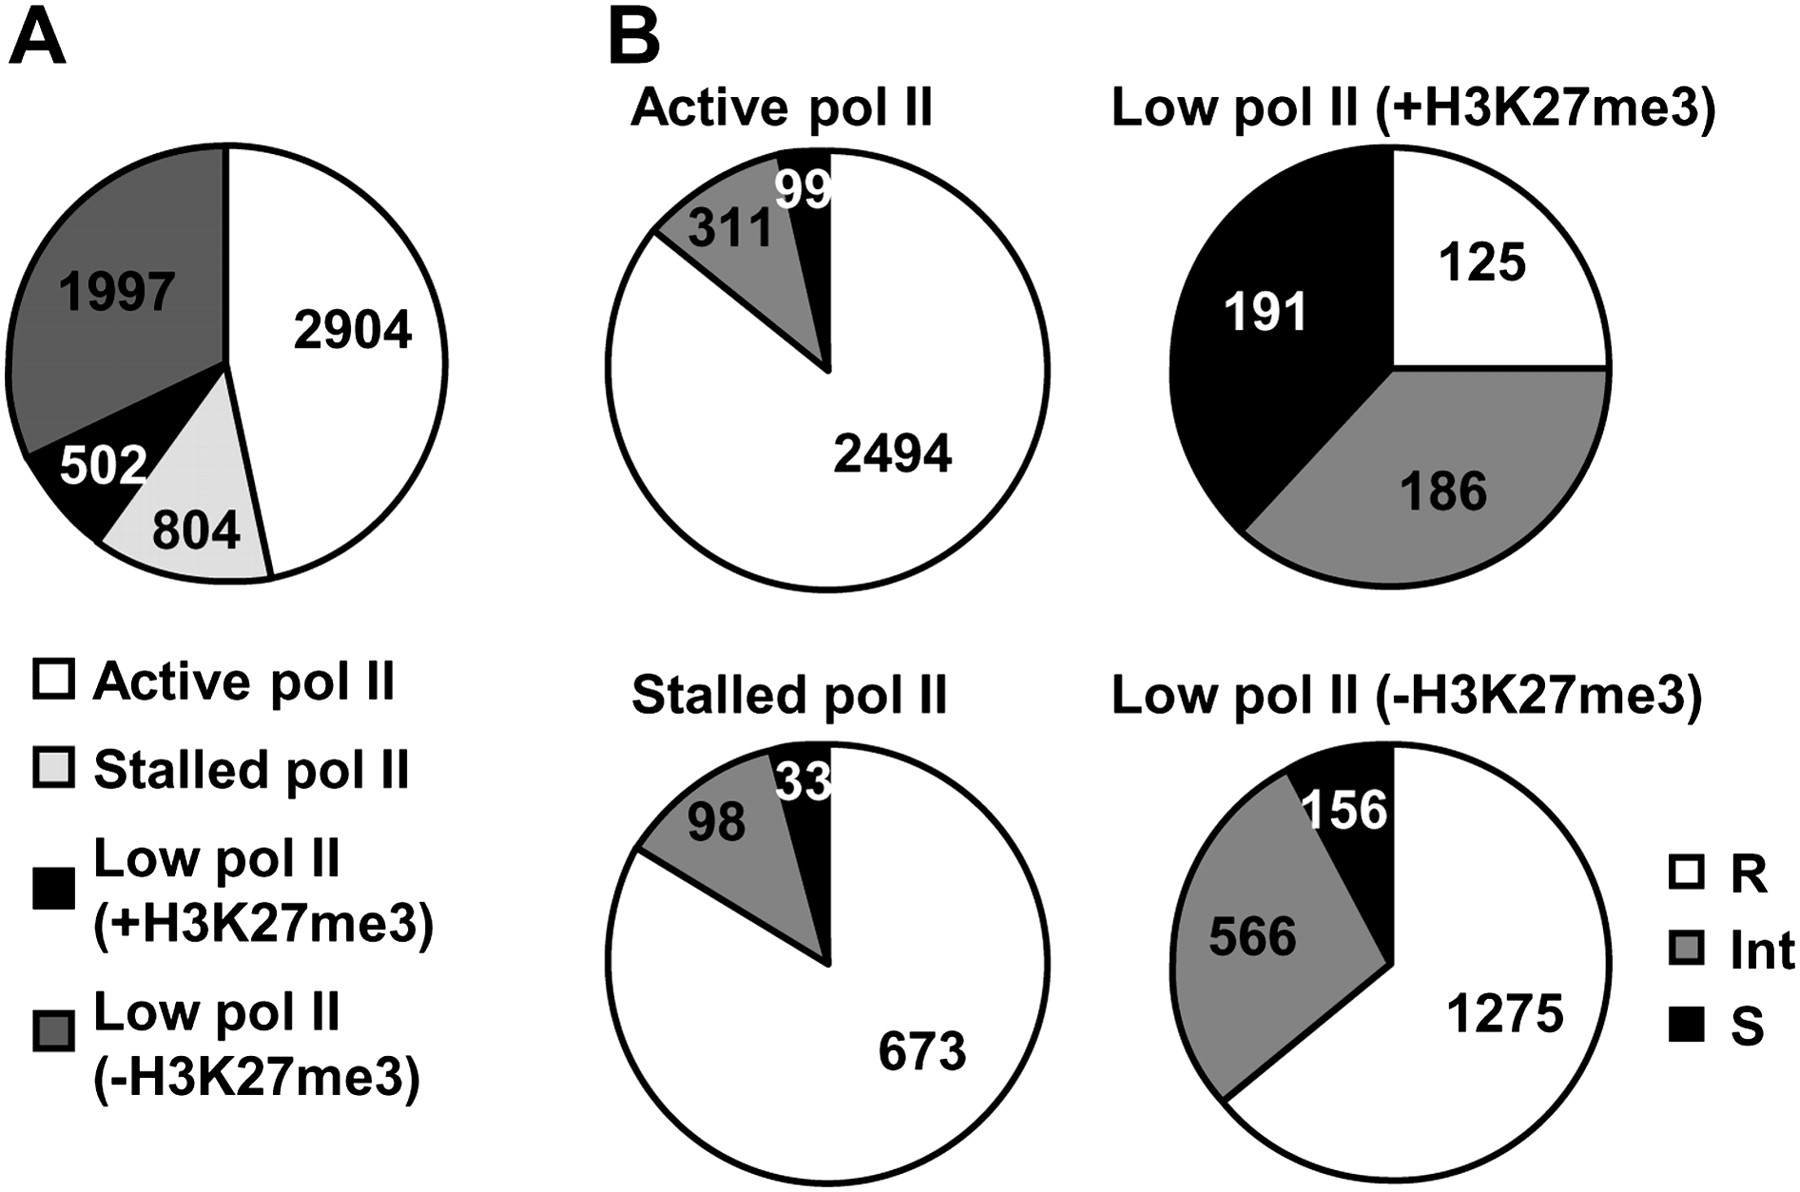
The association between Pol II binding and DNA methylation resistance in the total 6207 genes, regardless of transcription levels. (A) Classification of genes by Pol II status and H3K27me3 in the normal prostatic cell line. We were able to analyze transcription levels for 4567 of 5510 resistant, 1161 of 1330 intermediate, and 479 of 521 susceptible genes (total 6207 of 7361 genes) due to a difference in microarray platforms. Genes with high Pol II levels and high/moderate transcription levels were considered as those with “active Pol II.” Genes with high Pol II levels but low transcription levels were considered as those with “stalled Pol II.” Genes with low Pol II were further subdivided into those with and without H3K27me3. The numbers of genes with active, stalled, and low Pol II are shown. (B) The fractions of resistant, intermediate, and susceptible genes according to the Pol II and H3K27me3 statuses. Genes with either active or stalled Pol II had a larger fraction of resistant genes, and genes with low Pol II had a larger fraction of susceptible and intermediate genes.


