
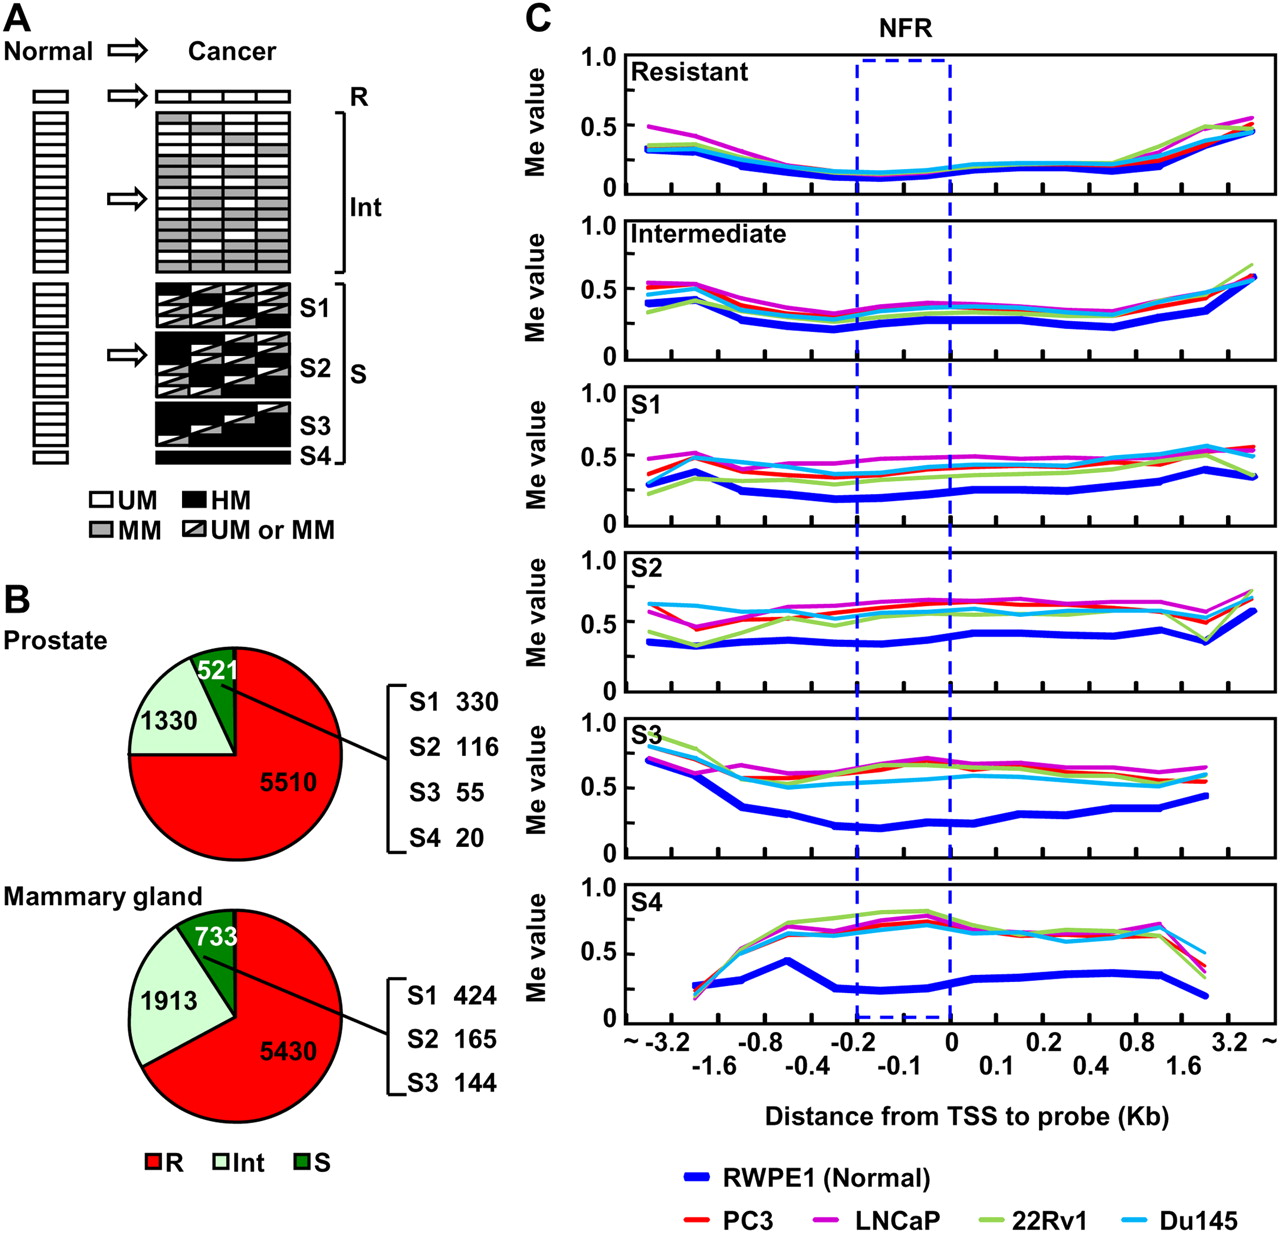
Identification of methylation-resistant and methylation-susceptible genes and their methylation profiles in various genomic regions against TSSs. (A) Definition of genes resistant and susceptible to induction of DNA methylation. Genes unmethylated (UM) (white) in the normal cell line (cells) and all cancer cell lines were defined as resistant genes (R). Genes unmethylated in the normal cell line (cells) but highly methylated (HM) (black) in at least one of the four cancer cell lines were defined as susceptible genes (S). Susceptible genes were further divided into four subclasses according to DNA methylation frequency in the cancer cell lines (S1–S4). Genes unmethylated in the normal cell line (cells) but moderately methylated (MM) (gray) in the cancer cell lines were defined as genes with intermediate susceptibility (intermediate genes: Int). (B) The fractions of resistant (red), intermediate (light green), and susceptible (green) genes in the prostate and the mammary gland. (Right side of the pie graph) Numbers of susceptible genes in each subclass (S1–S4). (C) DNA methylation levels at various positions against the TSSs in the normal prostatic cell line and four cancer cell lines. Average Me values of CGIs continuous from their NFRs are shown. (Blue dotted rectangle) The NFRs. Methylation levels of the NFRs were similar to those of upstream regions up to −800 bp and downstream regions up to +800 bp.


