
Cover image
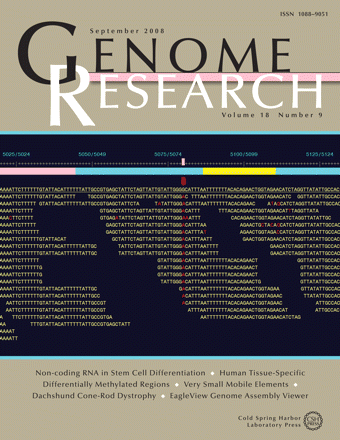
Cover EagleView visualization of next-generation genome assembly. In many applications of next-generation sequencing technologies, data visualization is essential for (1) identification of different types of errors from sequencing, read mapping, and assembly; (2) validation of candidate polyphormisms; (3) software development and testing; and (4) data interpretation and hypothesis generation. The illustration shows a genome assembly of 33-bp Illumina reads. Below the genome coordinates is the genome feature annotation bar with different colors representing promoter regions (pink), exons (cyan), and introns (yellow). The small pink rectangle above the features is the navigation cursor, and the small red rectangle below indicates a single nucleotide polyphormism site. (Cover illustration by Weichun Huang. [For details, see Huang and Marth, pp. 1538-1543.])

