
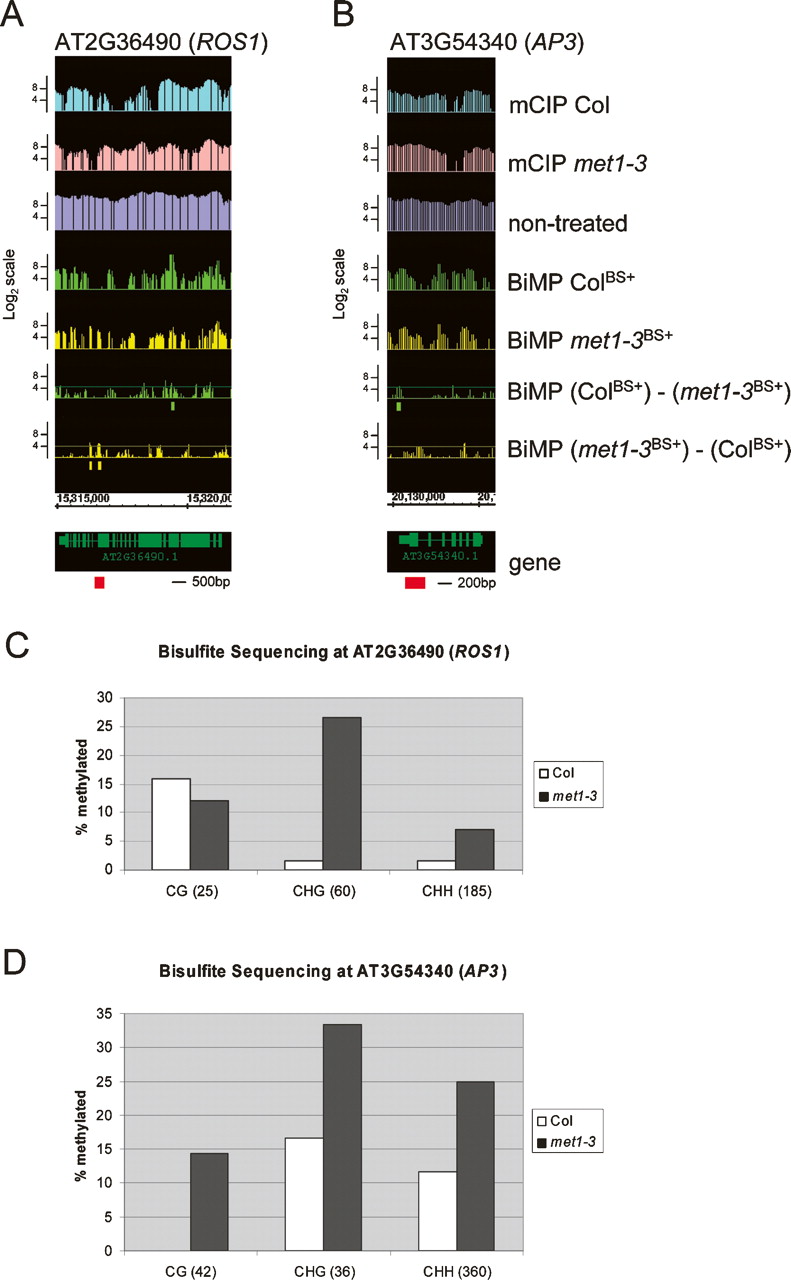
Figure 5.
Validation of novel methylation polymorphisms detected using BiMP. Graphs were prepared as in Fig. 3B. (A) AT2G36490 (ROS1), (B) AT3G54340 (AP3). (Red boxes) Regions that were bisulfite sequenced. (C,D) Bisulfite sequencing at the AT2G36490 (ROS1) (C) and AT3G54340 (AP3) (D) loci. The DNA methylation level (% methylated, Y-axis) was determined by bisulfite sequencing and presented for each different sequence motif: CG, CNG, and CHH (H = A, T, C) (see Methods). The total number of cytosines analyzed per sequence motif is provided within the parentheses.


