
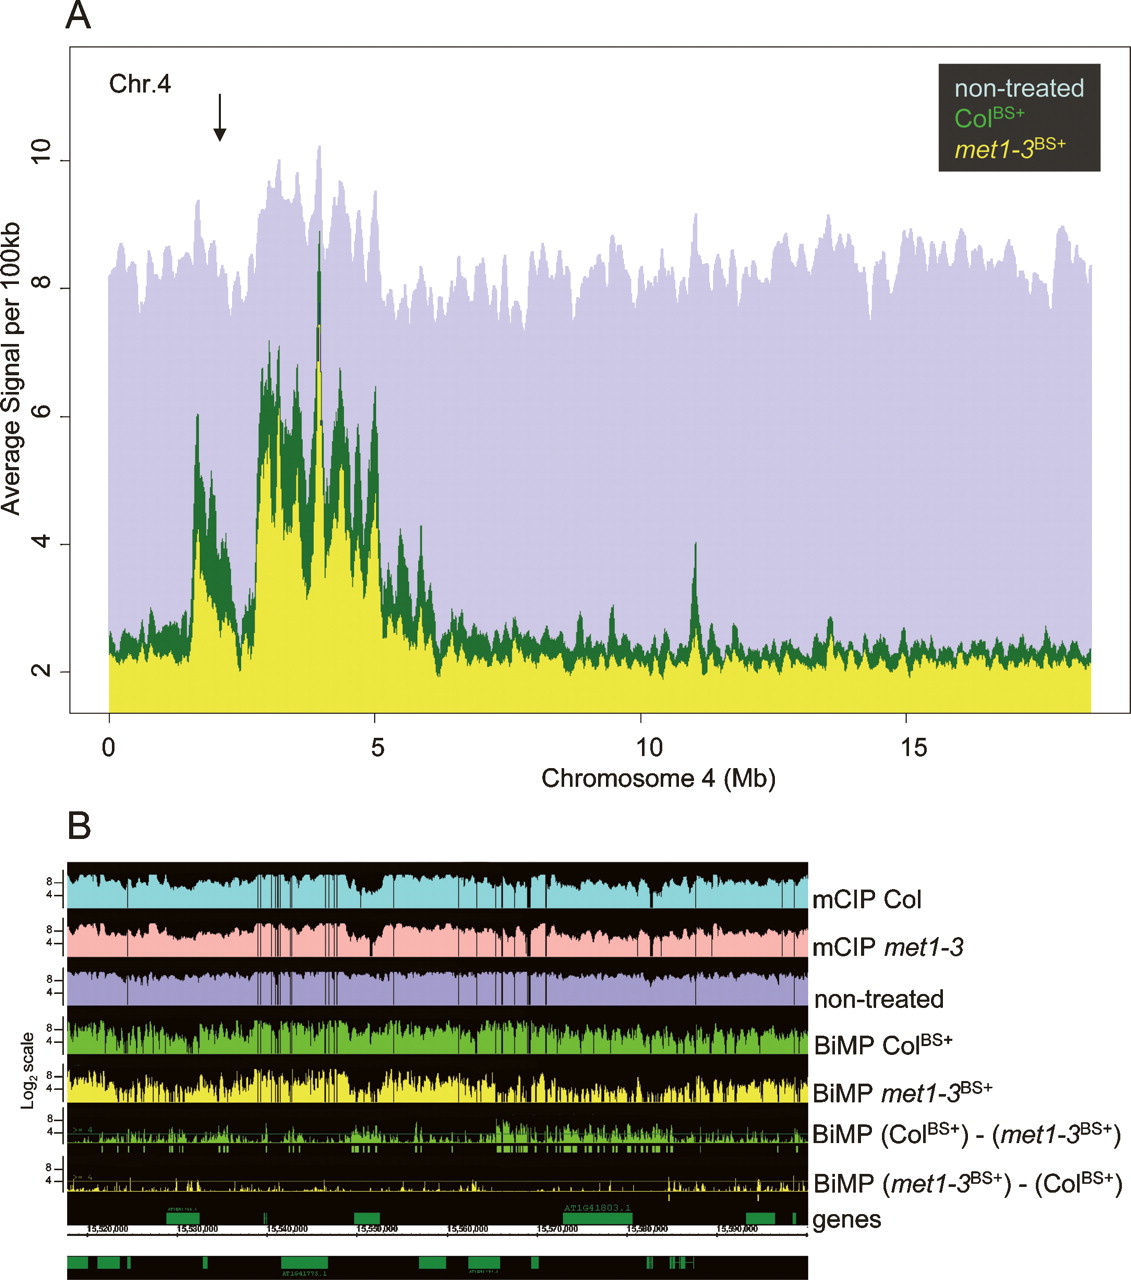
Bisulfite methylation profiling results visualized at the chromosomal level: chromosome 4 (A) and a pericentromeric region of chromosome 1 (B). (A) Graphs represent the average signal intensity per 100 kb (see Methods). (Green) ColBS+ hybridization, (yellow) met1-3BS+ hybridization, (purple) nontreated DNA hybridization. (X-axis) Physical length of chromosome 4 (NCBI Arabidopsis genome assembly version 5), (arrow) heterochromatic “knob” region. (B) Average hybridization signal intensity profiles across the pericentromeric region of chromosome 1 (chr1:15,520,000–15,600,000). Each tier represents a graph of the hybridization profile corresponding to each dataset (labeled at the right). The hybridization graphs were displayed in the range 0–11 (log2 scale). The difference graphs, BiMP (ColBS+) − (met1-3BS+) and BiMP (met1-3BS+) − (ColBS+), compare the BiMP profiles. The signal intensity differences above the applied cut-off (>4.0, horizontal line) are indicated for significantly hypomethylated intervals (green boxes) and hypermethylated intervals (yellow boxes) in met1-3BS+ relative to ColBS+.


