
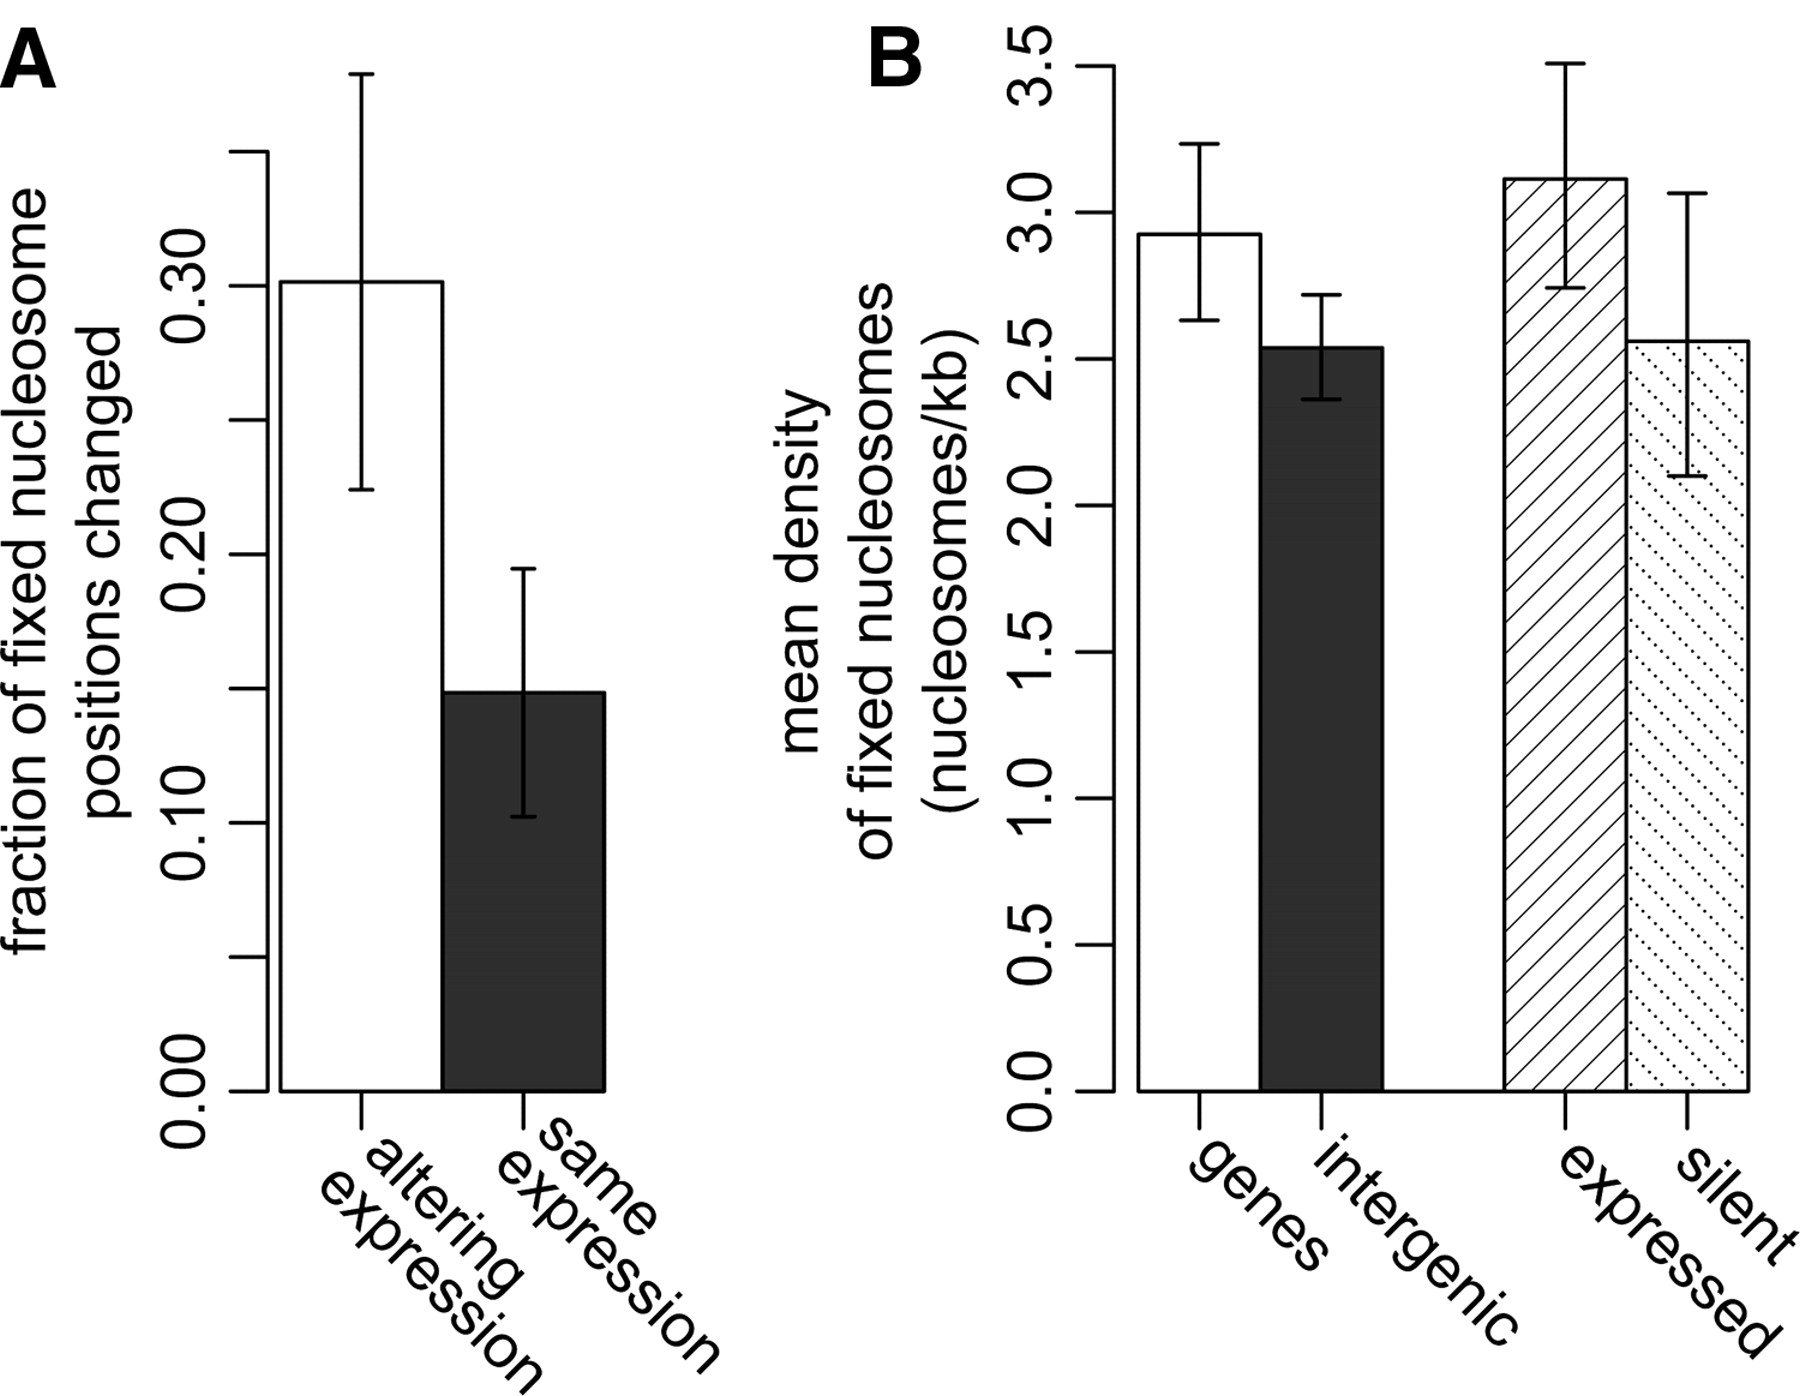
Fixed nucleosome density in gene regions. (A) Fraction of fixed nucleosome positions changing between HeLa and K562 cell lines is higher for protein-coding genes altering their transcription state (altering) and genes whose transcription state remains the same (same) between the two cell lines (t-test P-value < 0.0011). (B) Average mean nucleosome density is shown for gene body and intergenic regions. The average density for actively transcribed and silent genes is shown separately. Data from HeLa cells are used. Gene regions display higher density of fixed nucleosomes than the intergenic regions (P < 0.014); in HeLa cells, such a difference may be attributed to higher density at transcribed genes (P < 0.041). The error bars show 95% confidence intervals based on the exponential distribution models.


