
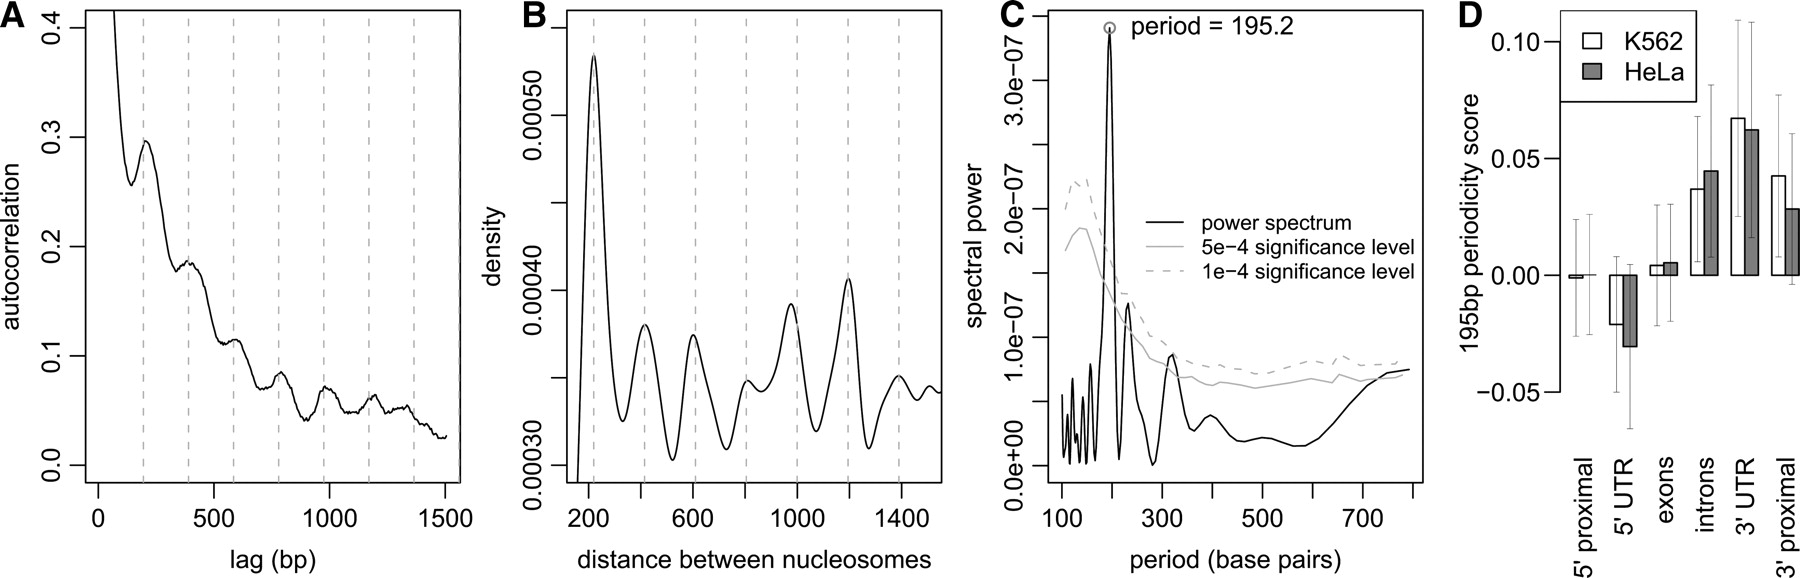
Fixed nucleosomes are organized into regular periodic arrays. (A) Autocorrelation function of the average pre-extracted chromatin profiles in K562 cells. (Dashed vertical lines) Locations of secondary peaks, spaced 195 bp apart. This demonstrates presence of pronounced 195-bp periodicity in the chromatin profiles. (B) Distribution of distances between identified fixed nucleosome positions is shown for nucleosomes 10 or fewer nucleosomes away from each other. The distance distribution clearly shows preferred internucleosomal distances that are multiples of 195 bp. (C) Fourier frequency decomposition of the nucleosome distance distribution confirming periodicity peak of 195 ± 7 bp in nucleosome positions. (Gray lines) Statistical significance levels of spectral power based on random positioning of nucleosomes in the tiled regions. (D) Mean 195-bp periodicity scores for different genomic elements. The periodic nucleosome arrays are preferentially localized near the 3′ regions of annotated genes. The periodicity scores at 3′ UTR regions are on average significantly higher than scores at the 5′ proximal, 5′ UTR, and exonic regions (t-test P-values < 4.1 × 10⁻³, 6.2 × 10⁻⁴, 7.5 × 10⁻³, respectively, in K562; 0.013, 0.0013, 0.019 in HeLa). The proximal regions are defined as 2-kb segments upstream and downstream of the annotated gene boundaries. The periodicity score is calculated using local autocorrelation (see Methods).


