
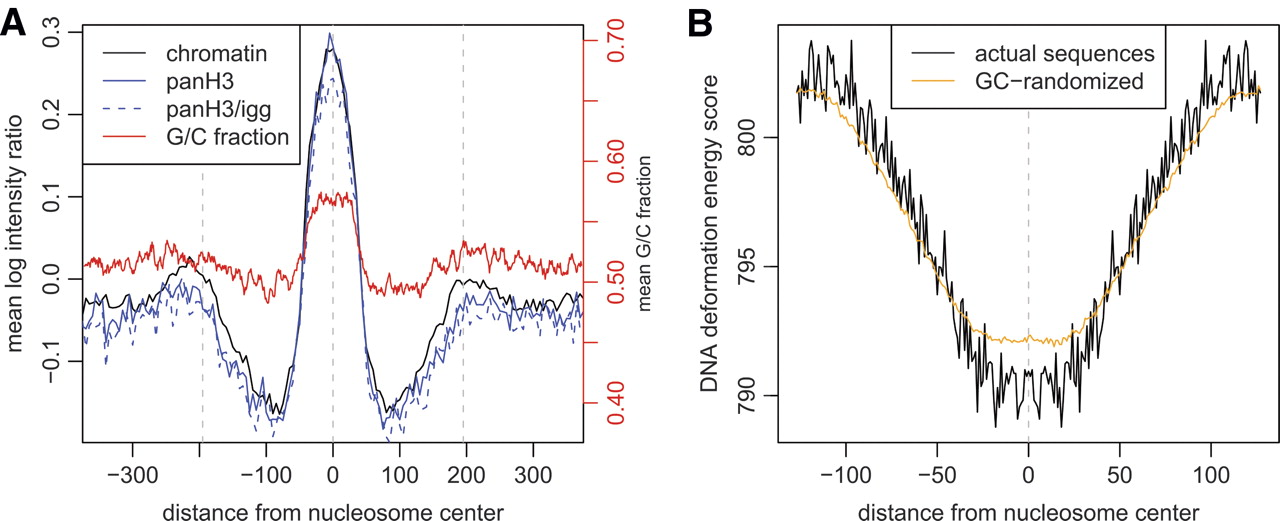
Average profiles and energy properties of nucleosome positions. (A) (Black line) Average pre-extracted chromatin log intensity ratio around fixed nucleosome positions. (Blue lines) Average pan-H3/input (solid) and pan-H3/IGG (dashed) log intensity ratio profiles, confirming that predicted fixed nucleosome positions correspond to areas of histone H3 enrichment. (Red line) Average G/C fraction smoothed with a window of 11 bp, with the G/C fraction scale shown on the left. Data from the K562 cell line are used. (B) Average nucleosome deformation energy profile around predicted fixed nucleosome positions. The score assesses the energy required to wrap a given DNA sequence around the histone core. A pronounced dip in the energy profile indicates that the predicted positions are energetically favorable for nucleosome integration. (Orange line) Expected energy profile based only on the dinucleotide properties of the predicted positions (see Methods). This illustrates that much of the energy dip can be attributed to increased occurrence of GC-rich dinucleotides around predicted nucleosome dyad positions. These dinucleotides are associated with reduced DNA deformation energy, which would facilitate histone core integration (Olson et al. 1998; Vinogradov 2003).


