
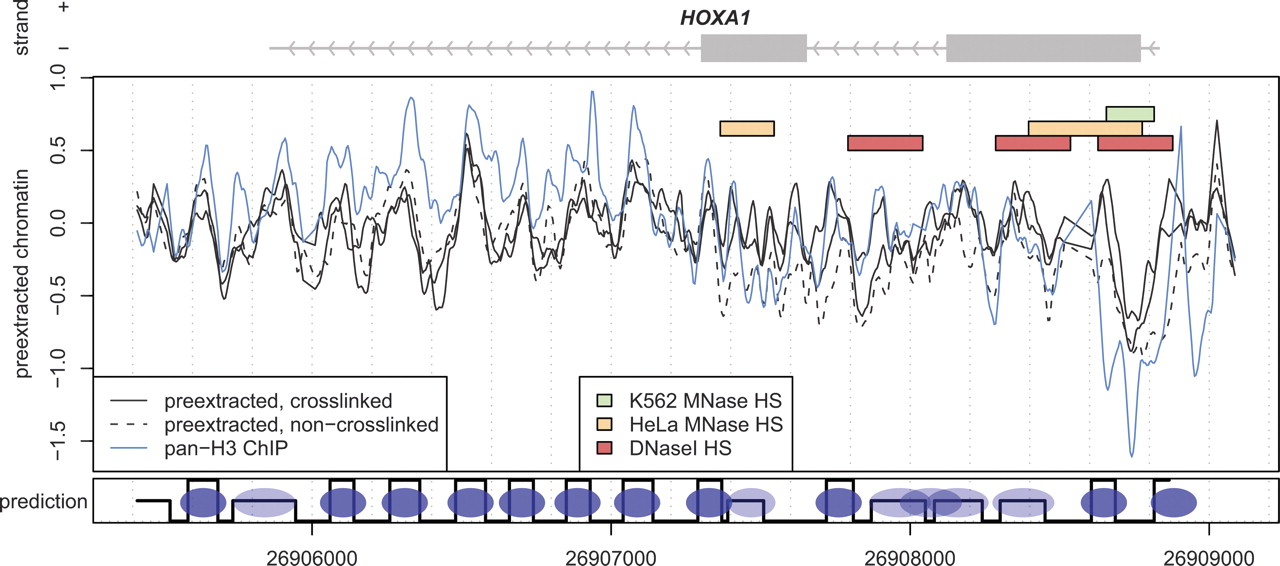
An example of measured chromatin profiles and nucleosome calls in the K562 cell line. (Top, gray) HOXA1 gene body (line) and exons (boxes). (Center main plot) Log intensity ratios for pre-extracted chromatin, with (solid lines) and without (dashed line) crosslinking. (Blue) Profile of pan-H3 ChIP measurement. (Colored bars) Positions of MNase hypersensitive sites identified in K562 cells (green), HeLa cells (orange, profiles not shown), and DNaseI hypersensitive site (red bar) identified by Sabo et al. (2006) in human lymphoblastoid cells. (Bottom track) Generated nucleosome predictions: (high values) fixed nucleosome predictions, (low values) linker regions, (intermediate values) likely positions of delocalized nucleosomes.


