
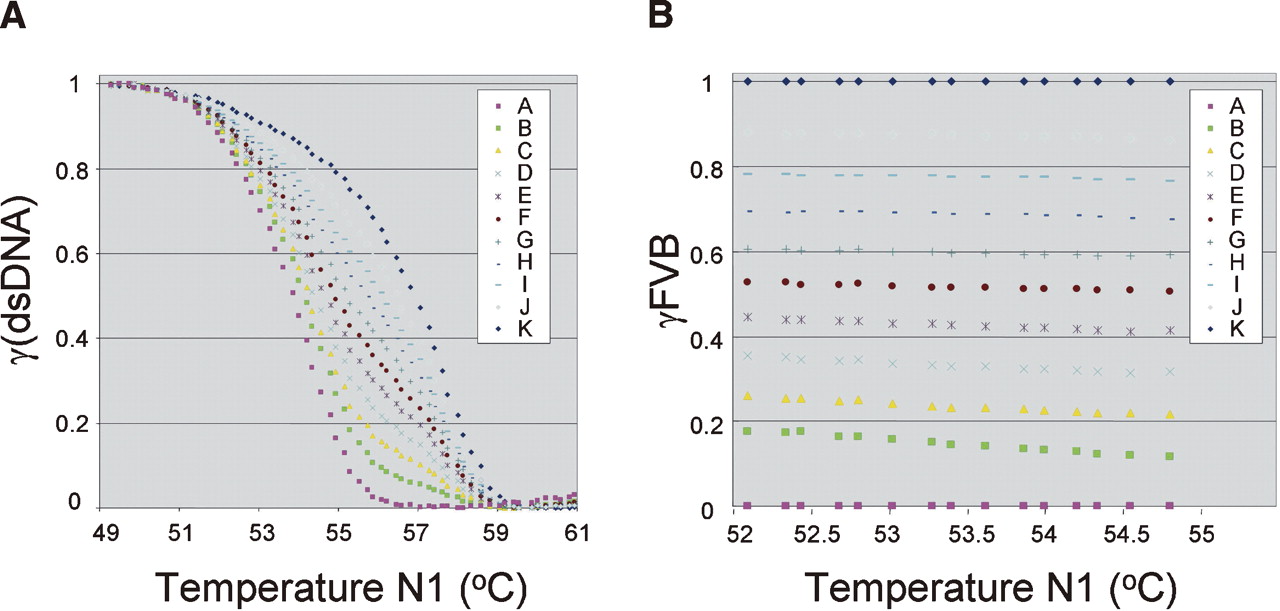
Melting curves for composite mixtures reflect the relative contribution of each of the two alleles. (A) Melting of FRET probe Afp-R from PCR amplicons of pure 129 (curve A), pure FVB (curve K), and of 129 + FVB mixtures (curves B–J). Mixes were generated prior to PCR amplification by pooling FVB and 129 cDNAs in proportions defined in Table 1. Note the ordered leftward shift (decreased Tm values) as the fractional value of 129 cDNA increases. (B) The calculated fractional values for FVB (γFVBs) at given temperatures were averaged and plotted. γFVBs were calculated using Equation 1, as described in the text, comparing every temperature pair that falls within the parameters described in Methods. Specifically, we used temperatures in which <90% but >10% of 129 amplicons were still double-stranded. For example, in this experiment, we used melting data from between 51.9°C and 55.5°C.


