
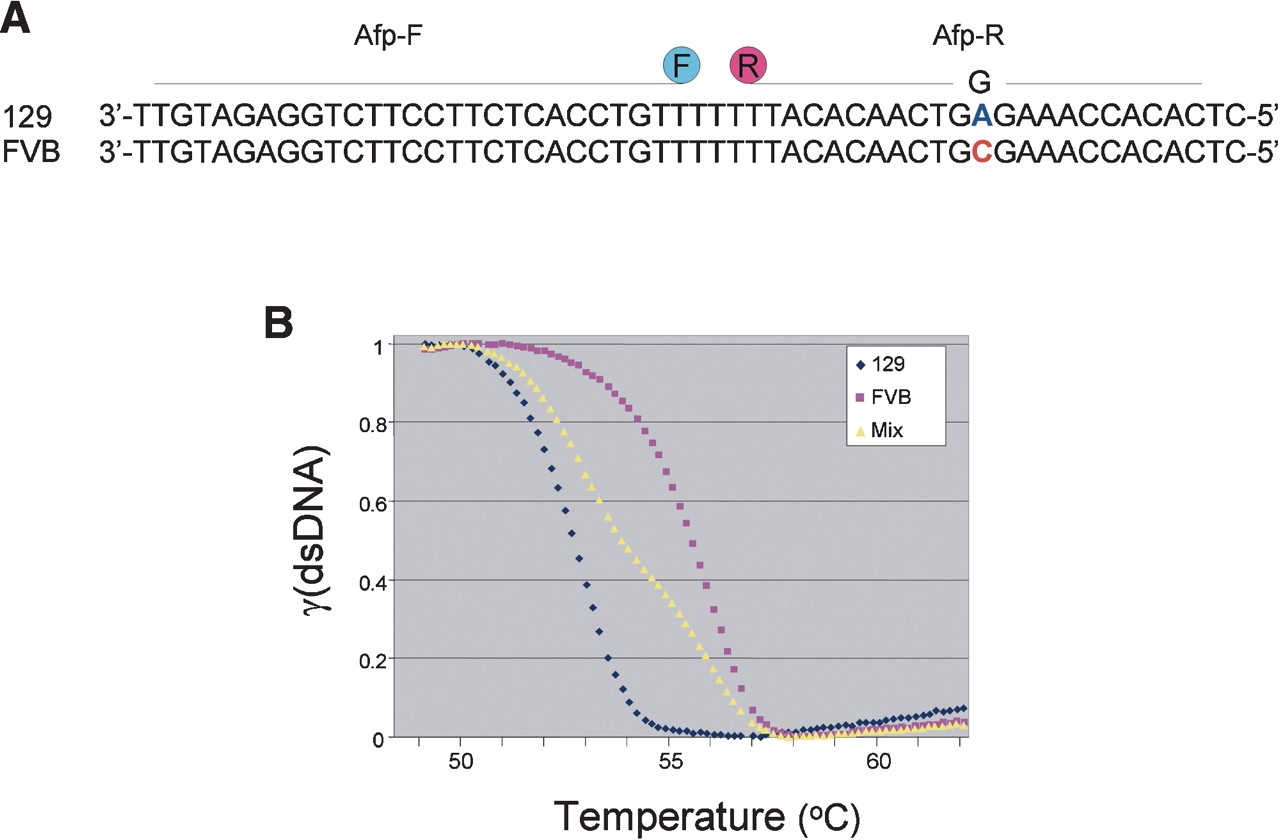
Characteristic melting curves distinguish DNAs differing at only a single base pair. (A) FRET probes Afp-F and Afp-R are labeled with fluorescein and with Red640, respectively. The SNP distinguishing 129 and FVB alleles is highlighted with bold type. (B) The melting of FRET probe Afp-R from mouse Afp cDNAs derived from 129 mice (blue diamonds), FVB mice (purple squares), or from a 1:1 volume mixture of 129 and FVB cDNAs (yellow triangles). DNA melting is assayed by loss of fluorescence at 640 nm and then normalized as described in the text so that the Y-axis reflects the relative fraction of remaining dsDNA [γ(dsDNA)]. Note the leftward shift of the 129 cDNA melting, consistent with its single base-pair mismatch of probe Afp-R.


