
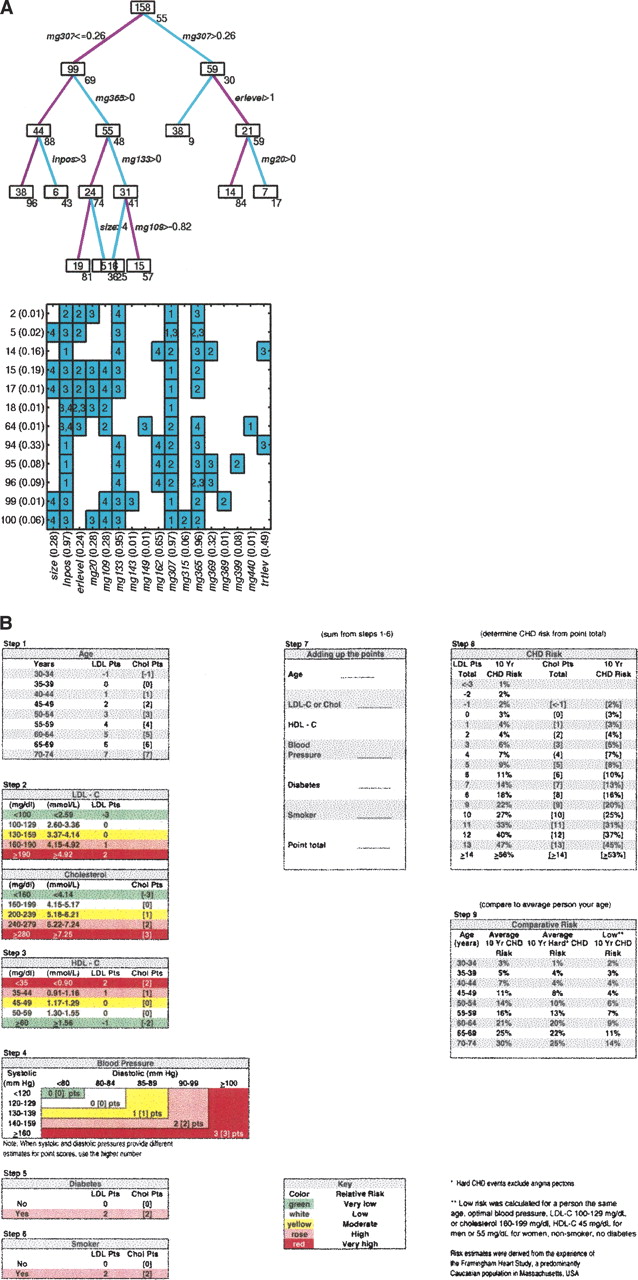
Combining multiple data to build predictive models. (A) Breast cancer recurrence. (Upper panel) An example of a single statistical classification tree model illustrating the utilization of gene expression profiles together with clinical variables to determine successive partitions of the patient sample with associated predictions. The boxes at each node of the tree identify the number of patients, and the number under each box is the corresponding model-based point estimate of the 4-yr recurrence-free probability (given as a percentage) based on the tree model predictions for that group. Overall practical predictions of survival risk are based on statistical aggregation of predictions across multiple such models; this multiplex prediction reflects the inherent complexity of the disease process and its bearing on survival risks. (Lower panel) The figure summarizes the level of the tree model in which each variable appears and defines a node split. The numbers on the left simply index tree models, and the probabilities in parentheses on the left indicate the relative weights of tree models based on fit to the data. The probabilities associated with clinical or metagene predictor variables (in parentheses on horizontal axis) are sums of the probabilities of trees in which each occurs, and so define overall weights indicating the relative importance of each variable to the overall model fit and consequent recurrence predictions. Clinical predictors, including lymph node status, tumor size and ER status, maintain predictive roles in some of the combined clinico-genomic tree models, whereas metagene predictors replace them in others. Adapted with permission from the National Academy of Sciences, U.S.A. © 2004, Pittman et al. 2004. (B) Coronary artery disease. Score sheet for estimating the risk of coronary heart disease over a period of 10 yr based on data from the Framingham Risk Study. Reprinted with permission from Lippincott, Williams and Wilkins © 1998, Wilson et al. 1998.


