
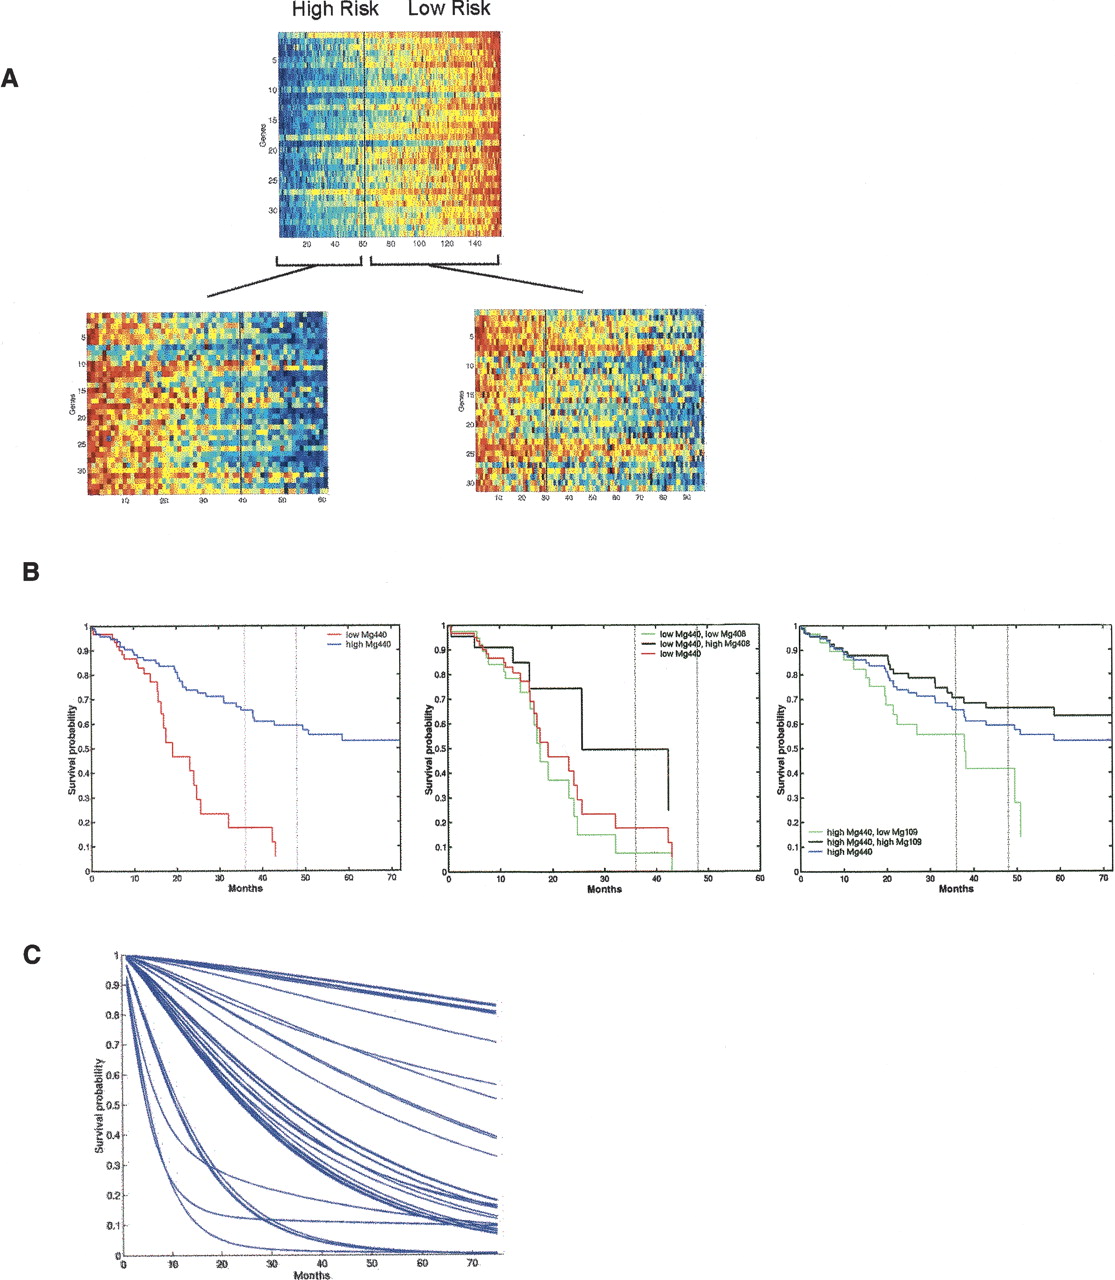
Utilizing multiple gene expression profiles to dissect cancer heterogeneity. (A) An example of the use of multiple profiles to predict recurrence of breast cancer. An initial gene expression profile (top pattern) is shown to split the patient population into high-risk and low-risk groups. The image shows the expression pattern of the genes in an aggregate signature or metagene labeled Mg440 (ordered vertically by correlation with Mg440) on the entire group of 158 patients. Samples are ordered (horizontally) by the value of Mg440, and the vertical black line indicates the split of patients into two subgroups underlying the empirical survival curves shown in the left panel of Figure 2B. The two subgroups of patients defined by this initial split are then further split with two additional metagenes. The “low Mg440” subgroup is further split based on Mg408, and the “high Mg440” group is split on Mg109. The two subsequent images show the patterns of genes within each of Mg408 and Mg109 for the corresponding two subgroups of patients, arranged similarly within each group and also indicating the second level splits. Red color in the plot defines high expression, and blue is low expression. Modified with permission from the National Academy of Sciences, U.S.A. © 2004, Pittman et al. 2004. (B) Sample survival characteristics based on a single gene expression profile versus multiple profiles. Empirical survival estimates based on a partition into two groups via a threshold on the gene expression pattern of Mg440 (left panel), and then the subgroups identified by splits with Mg408 (middle panel) and Mg109 (right panel). Modified with permission from the National Academy of Sciences, U.S.A. © 2004, Pittman et al. 2004. (C) Survival predictions for the entire population of 158 breast cancer patients using a full, integrated clinico-genomic model that combines multiple gene expression patterns with clinical information.


