
Table 2.
Normalized mutation frequencies per 1000 positions and transitions/transversions ratio in the pooled data analysis
Click on table to view larger version.
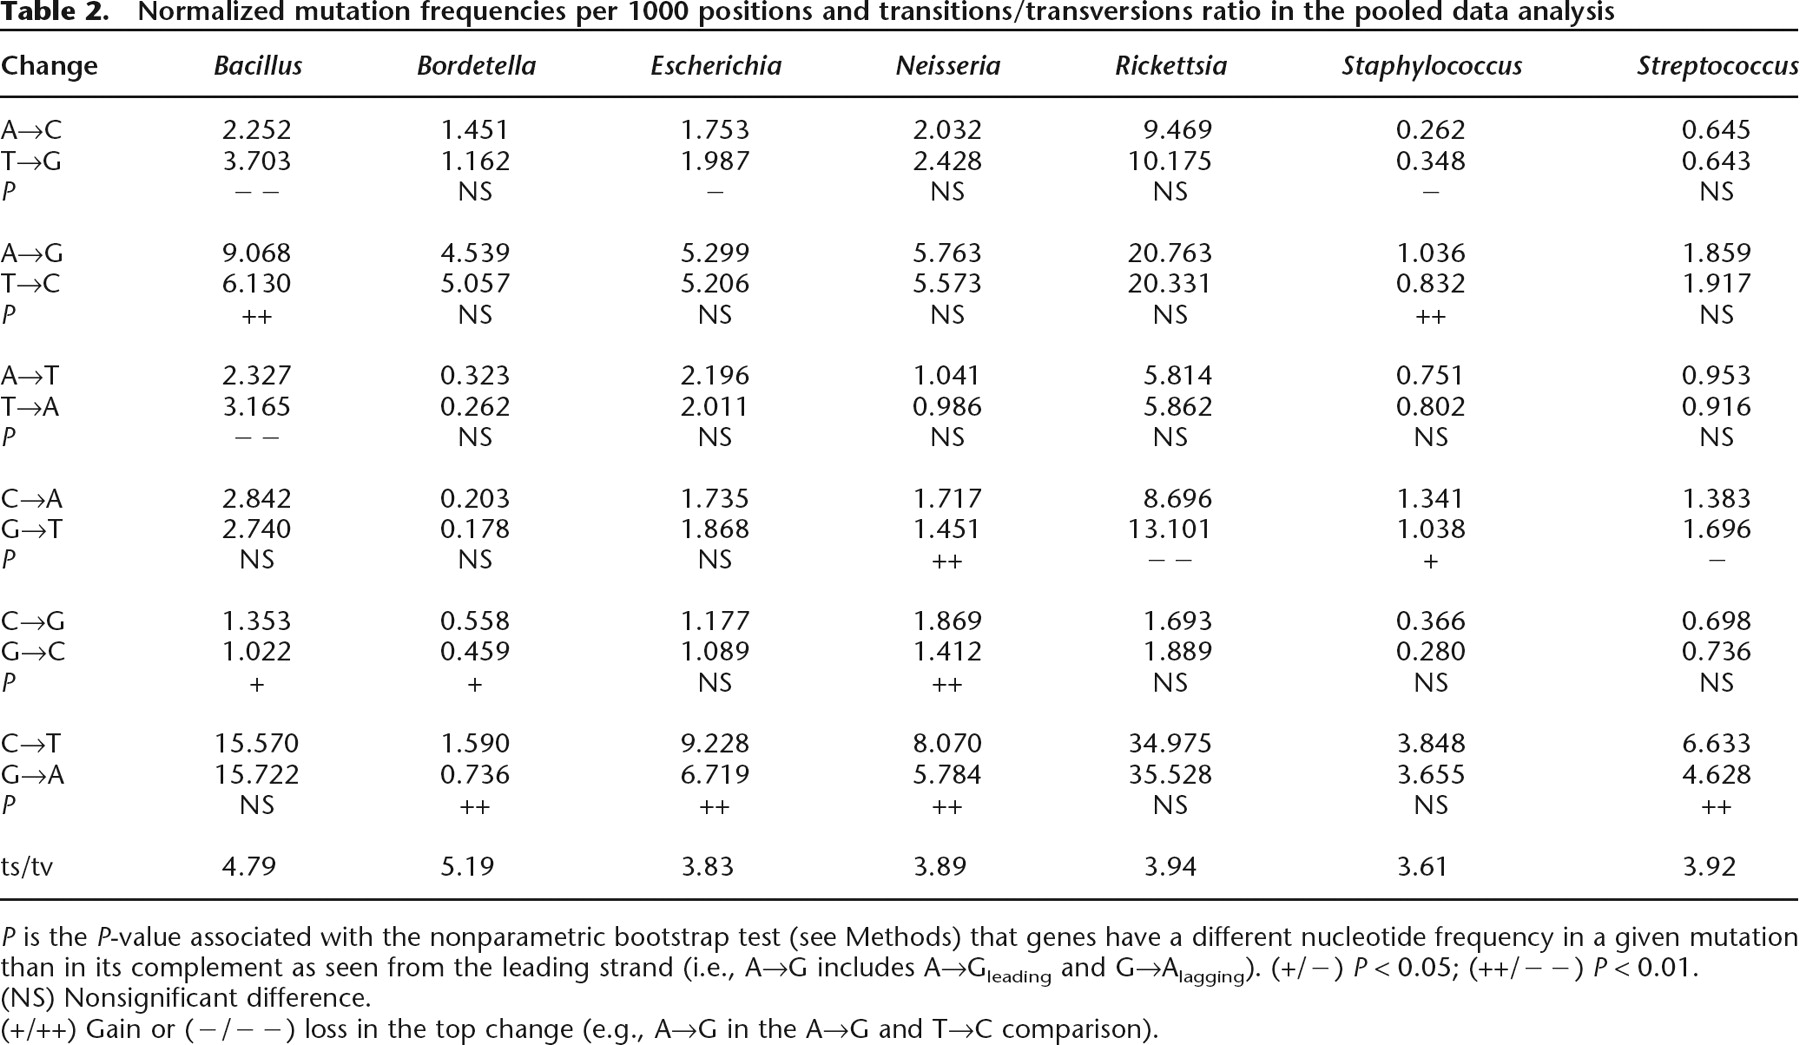
P is the P-value associated with the nonparametric bootstrap test (see Methods) that genes have a different nucleotide frequency in a given mutation than in its complement as seen from the leading strand (i.e., A→G includes A→Gleading and G→Alagging). (+/−) P < 0.05; (++/−−) P < 0.01.
(NS) Nonsignificant difference.
(+/++) Gain or (−/−−) loss in the top change (e.g., A→G in the A→G and T→C comparison).


