
Table 1.
Bacterial genomes used in the study
Click on table to view larger version.
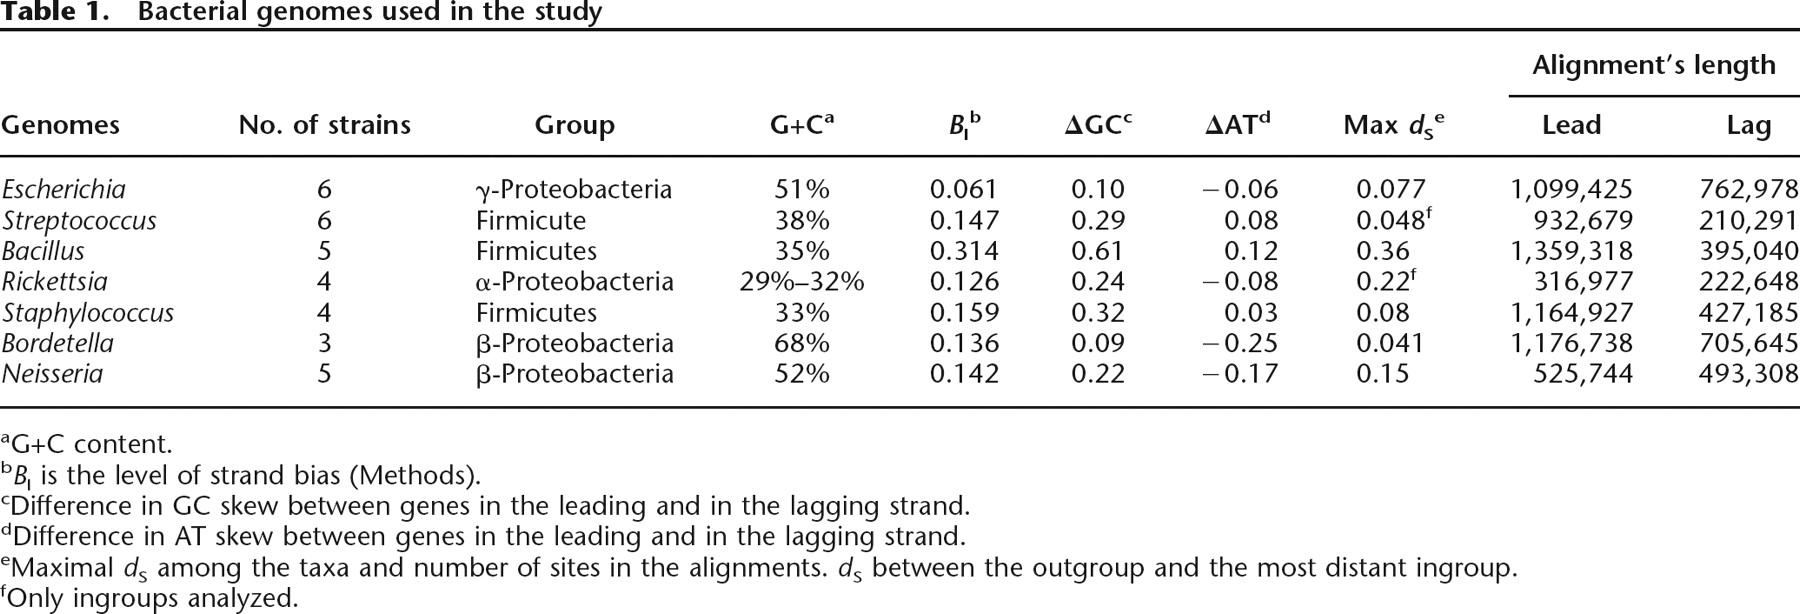
aG+C content.
bBI is the level of strand bias (Methods).
cDifference in GC skew between genes in the leading and in the lagging strand.
dDifference in AT skew between genes in the leading and in the lagging strand.
eMaximal dS among the taxa and number of sites in the alignments. dS between the outgroup and the most distant ingroup.
fOnly ingroups analyzed.


