
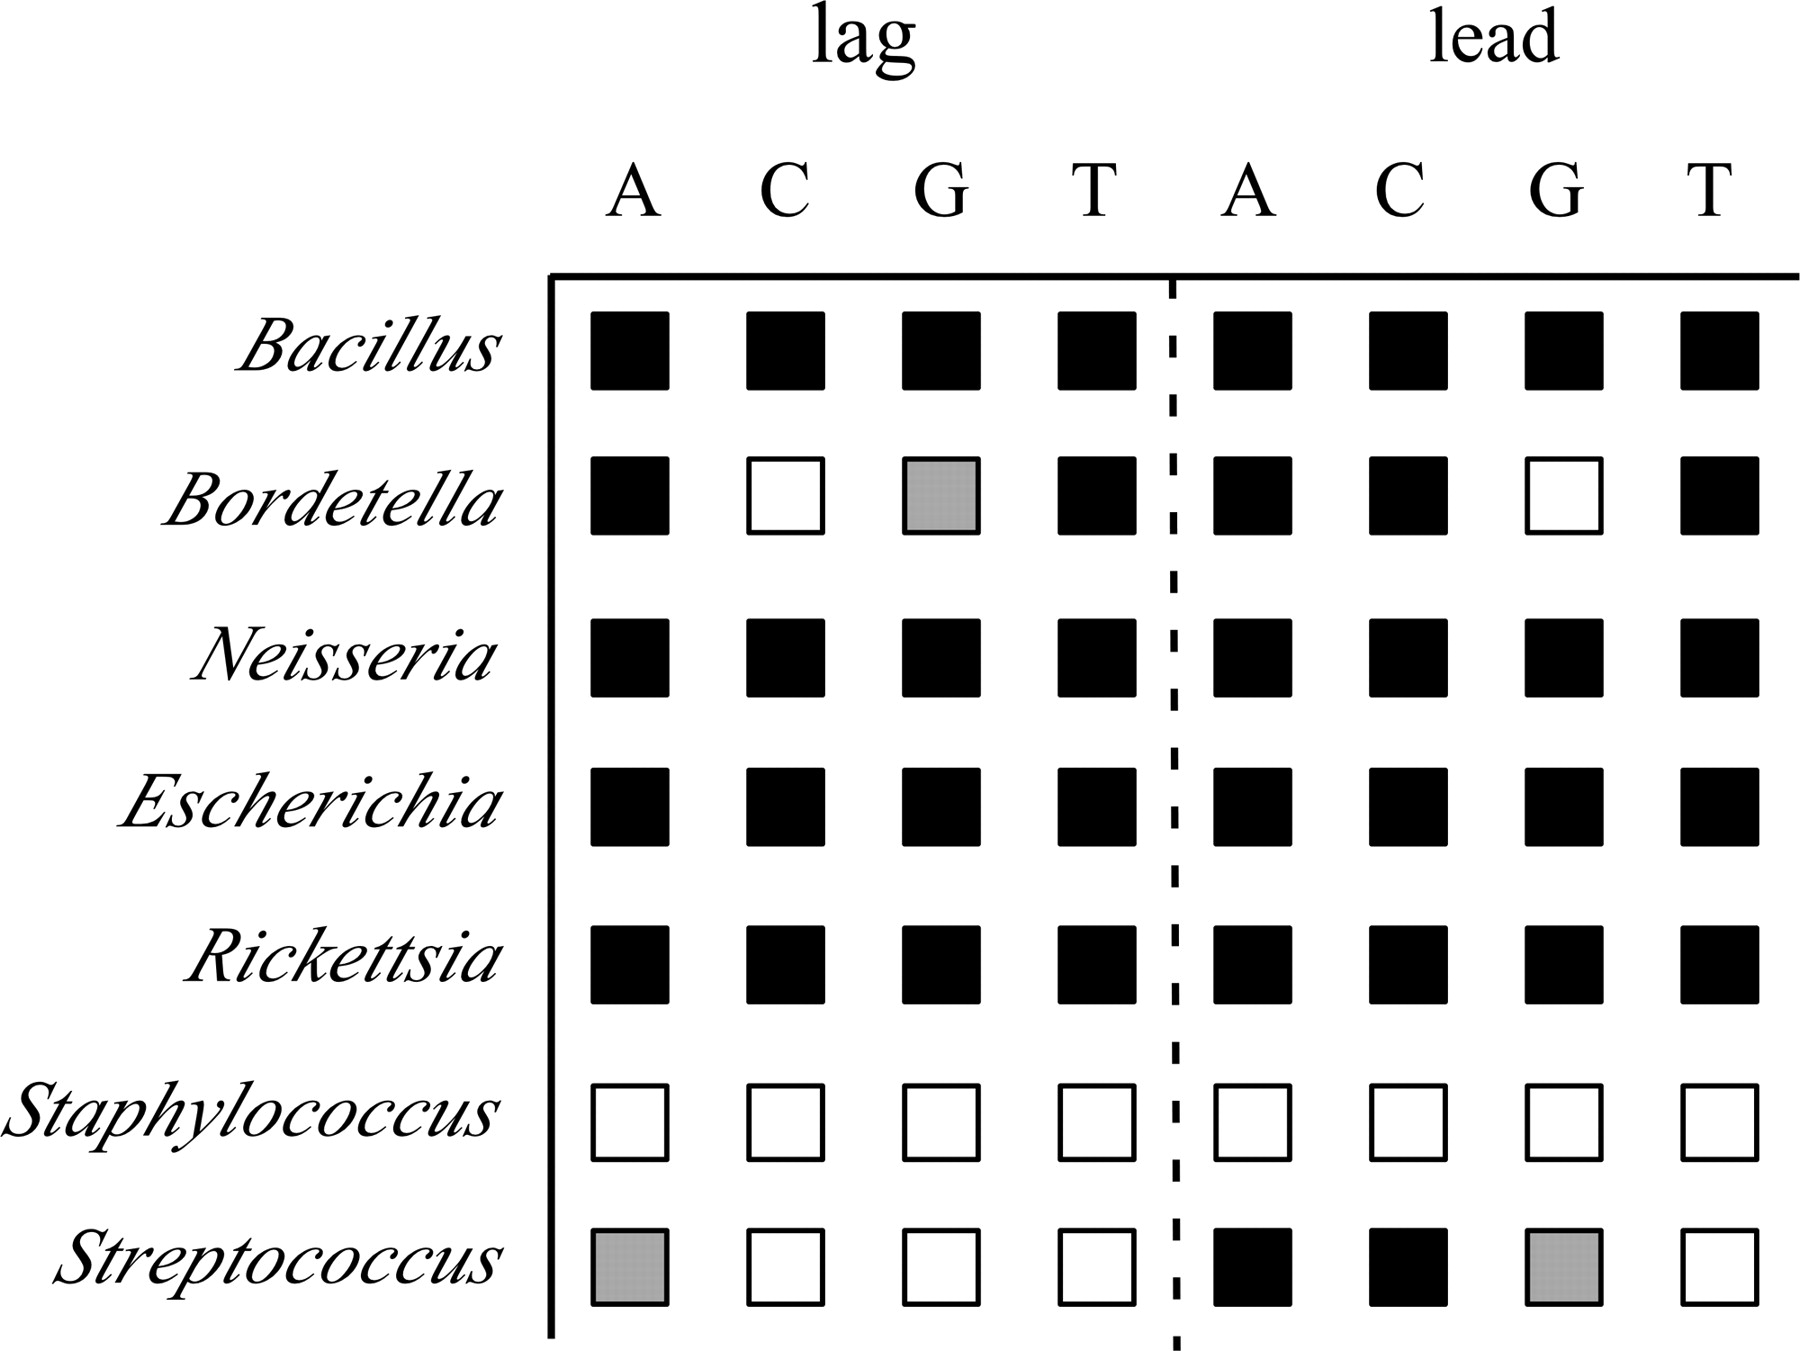
Figure 5.
Results of the tests that composition at equilibrium is significantly different from the current composition. For each nucleotide the test was done on the lagging/leading strand. (Gray) P < 0.05; (black) P < 0.01; (white) NS.


