
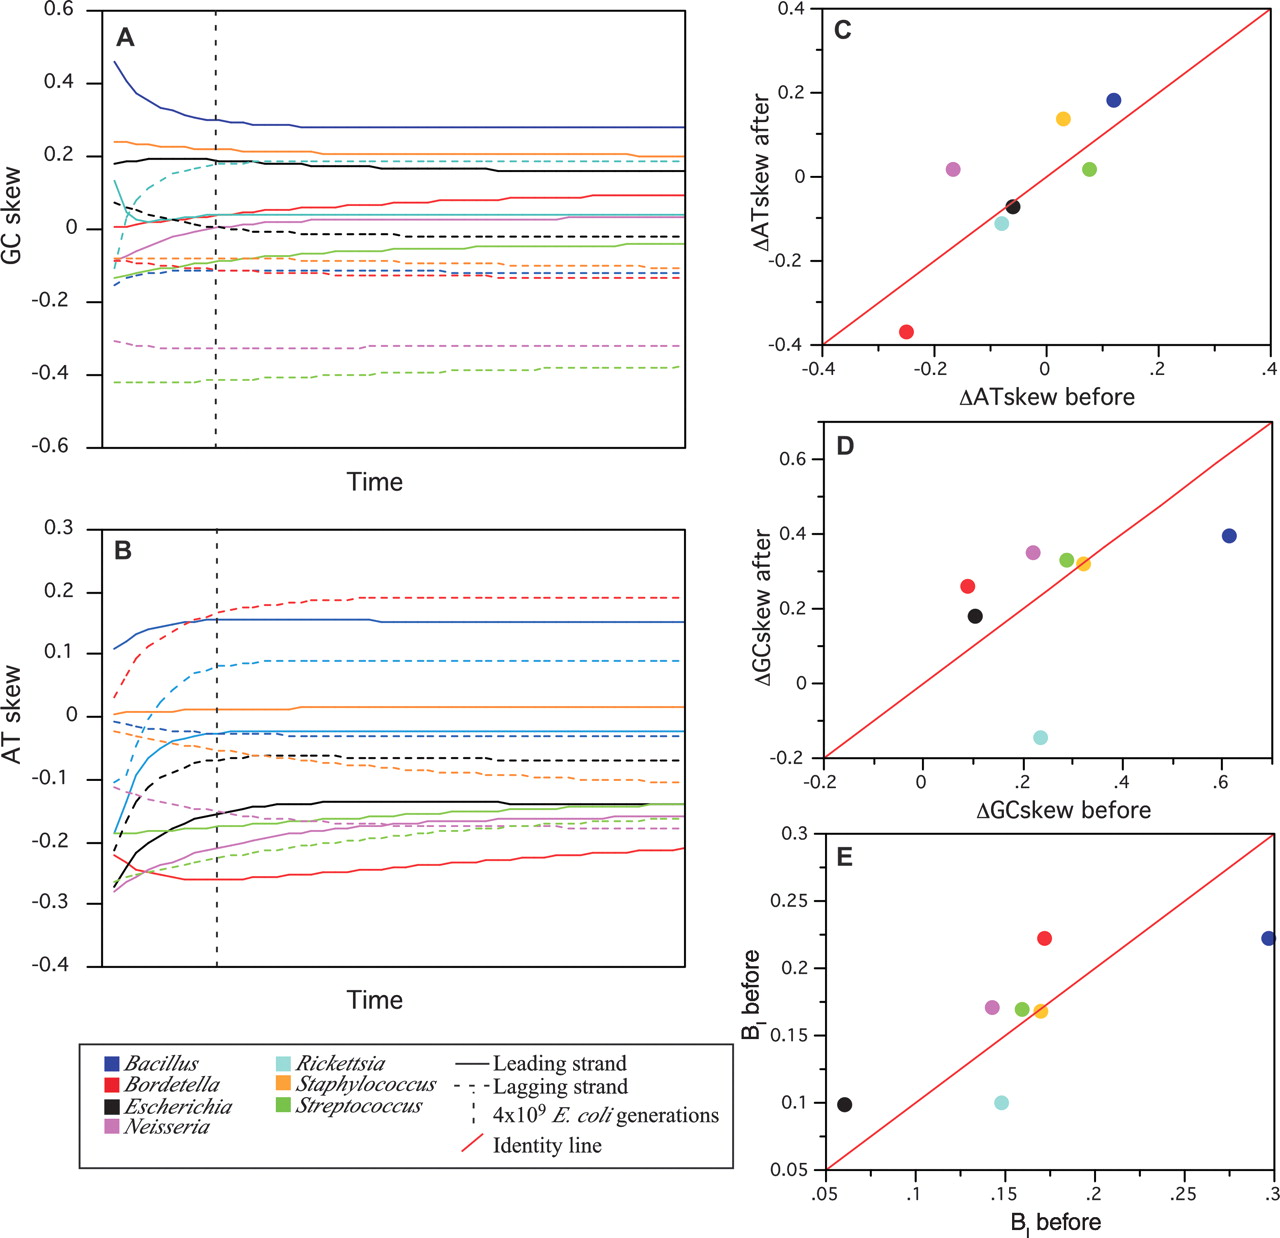
Evolution of (A) GC skews and (B) AT skews from actual values to the values close to equilibrium in each replicative strand of each clade using the substitution frequencies computed in Supplemental Table 2. The results for the leading strand are in solid lines, and the results for lagging strands are in dashed lines. The units in the x-axes are arbitrary and represent the iteration of the transition matrix in the simulations. To provide an order of magnitude of the number of generations required to attain equilibrium, we indicate by a dashed vertical line the point corresponding to 4 × 10⁹ E. coli generations (∼20 million yr). This calculation is just indicative and assumes a mutation rate of 10−9 per generation and 200 generations per year. (C) ΔAT skew, (D) ΔGC skew, and (E) BI change from the actual genome (before) to the values predicted at equilibrium (after).


