
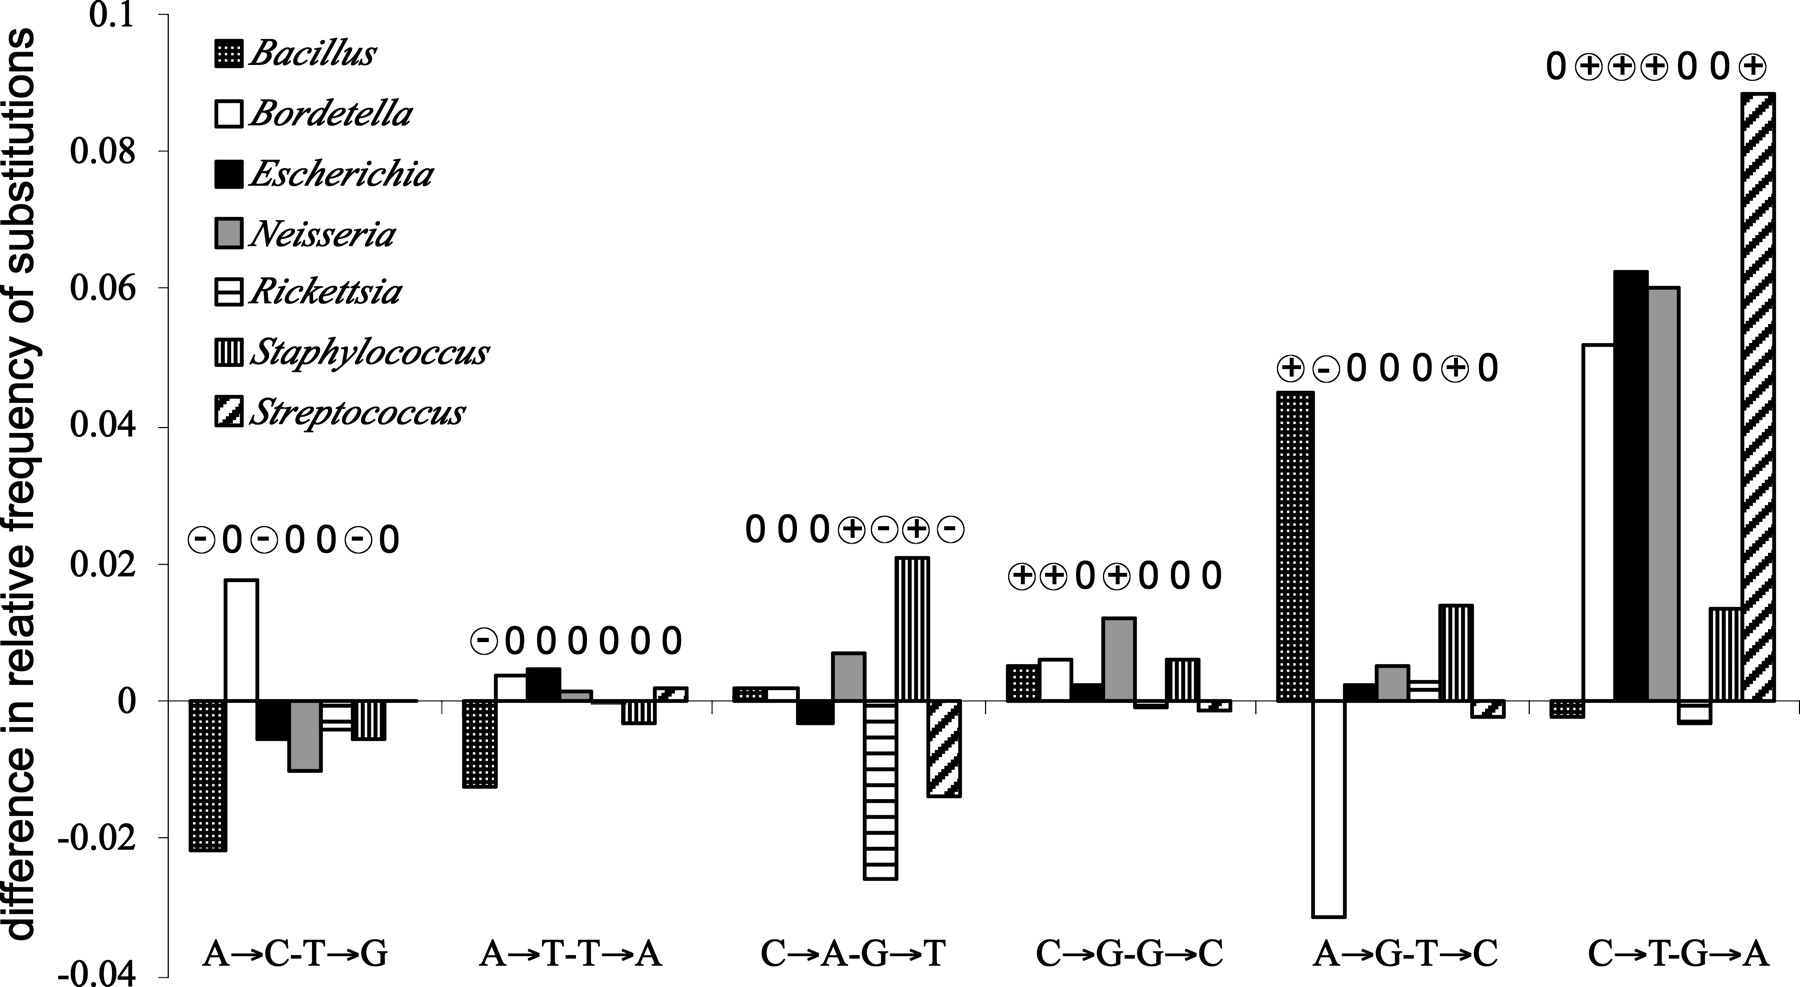
Figure 3.
Difference between the pairs of symmetric substitutions in different genomes. We took the data in Supplemental Table 1 and normalized for each genome so that the sum of the frequencies of each type of substitution is 1. Hence, high absolute values reveal unbalance within the clade, but they differ in terms of statistical robustness because of the different number of variable sites in each clade. (+/−) Significantly different from 0 (P < 0.05).


